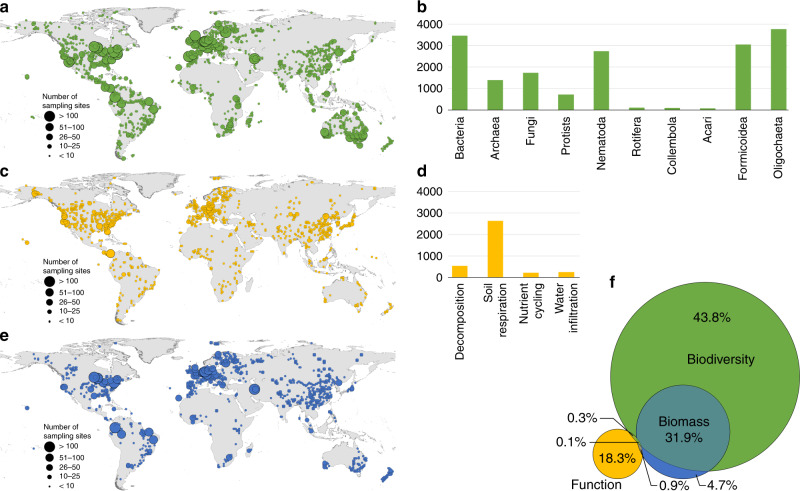
Fig. 1. Global distribution of sampling sites for soil taxa and soil ecosystem functions.
a, b correspond to the global number of individual sampling sites for each soil taxon, c, d to the distribution of ecosystem functions, and e to the distribution of samples with biomass data. The venn diagram (f) indicates the proportion of sampling sites for soil taxa (in green), functions (in yellow), and biomass (in blue), and the 0.3% (N = 63) of overlap between biodiversity and function data points (this number does not mean that soil biodiversity and function were assessed in the same soil sample or during the same sampling campaign; i.e., there are thematic or temporal mismatches, see Supplementary Fig. 11 for more details), relative to the total number of sampling sites covered by the studies. The maps show the overall spatial distribution of sampling sites for all taxa (a) and soil ecosystem functions (c). The size of the circles corresponds to the number of sampling sites within a 1° grid ranging from <10 to >50. All supporting data at: 10.6084/m9.figshare.12581306.

