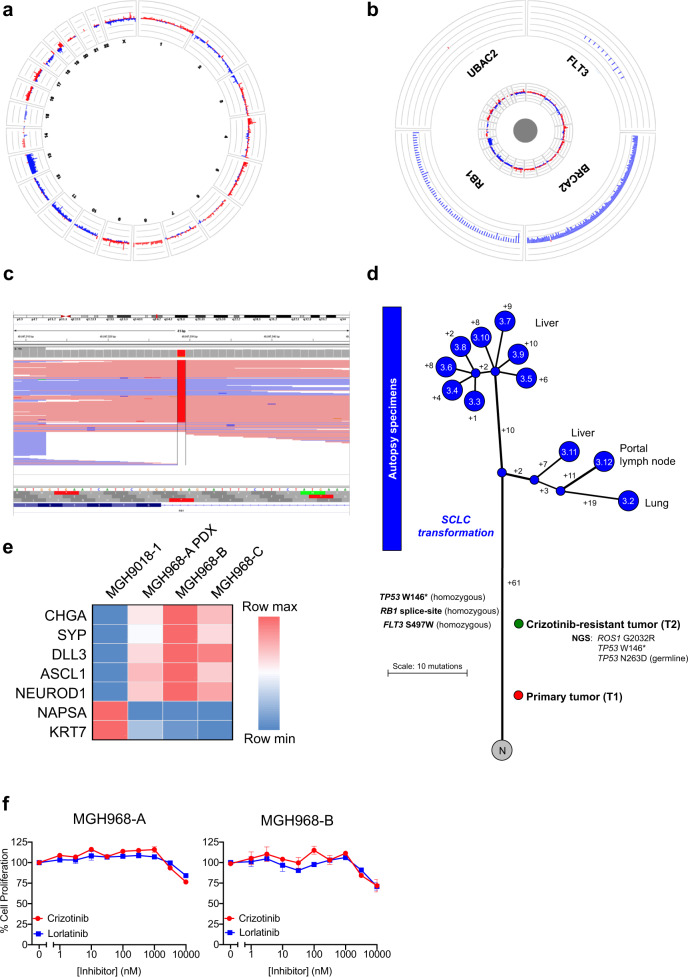
Fig. 2. Genetic and phylogeny analysis of metastatic tumors.
a Circos plots for a representative autopsy tumor specimen, providing a high-level overview of genomic gains (red) and losses (blue) across all evaluable probes in all chromosomes. There are diffuse losses across chromosome 13. b A higher magnitude view of four genes on chromosome 13 demonstrating loss of RB1. c Next-generation sequencing pile-up illustrating the presence of a splice region variant in RB1 in the majority of the reads. d Branching diagram of the metastatic tumors collected at autopsy and analyzed by whole-exome sequencing. The numbers on the branches represent the number of distinct mutations (synonymous and non-synonymous). “N” refers to normal tissue. The treatment-naive tumor (T1) and the crizotinib-resistant tumor (T2) were not analyzed by whole-exome sequencing, and therefore, could not be located precisely in this diagram. e Decreased expression of lung epithelial genes and increased expression of neuroendocrine genes in the MGH968-A PDX, MGH968-B, and MGH968-C cell line models, as determined by quantitative RT-PCR. MGH9018-1 is a cell line derived from a crizotinib-resistant CD74-ROS1 fusion-positive adenocarcinoma and is shown for comparison. f Resistance of MGH968-A and MGH968-B cells to clinically available ROS1 inhibitors. The proliferation assay was performed in triplicate, and the error bars represent the standard error of the mean.

