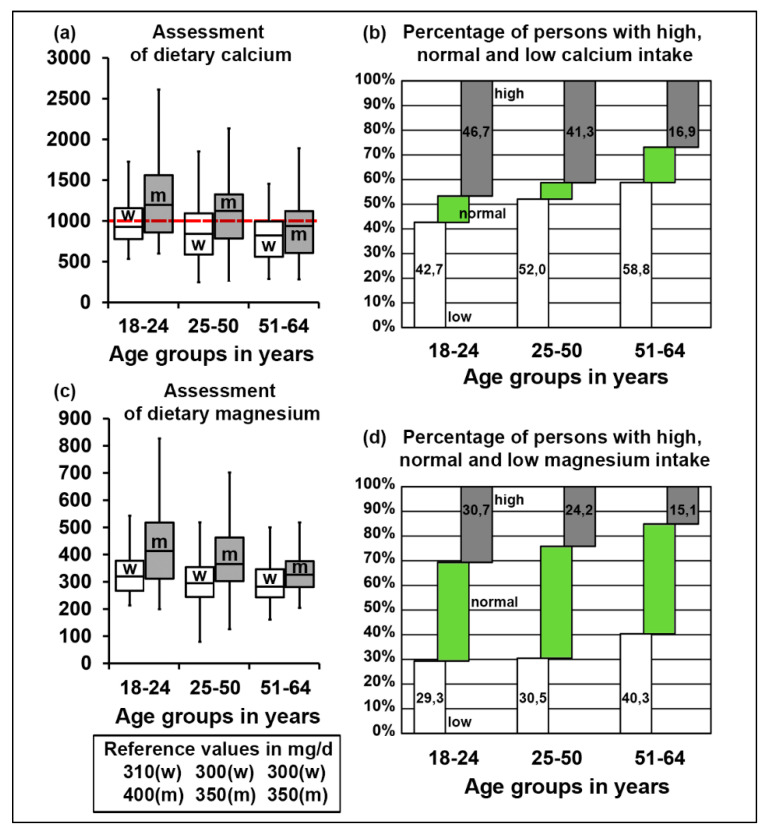
Figure 4.
(a) Median intake levels of calcium in different gender and age groups in mg/day. Red dashed line depicts the recommended intake level for calcium, w indicates women, m–men. (b) Percentage of persons with a discrepancy between reported calcium intake and the reference values in different age groups. (c) Median intake levels of magnesium in different gender and age groups in mg/day. Reference values for different gender and age groups are specified in the table below, w indicates women, m–men. (d) Percentage of persons with a discrepancy between reported magnesium intake and the average of reference values in different age groups. See also Table S2.

