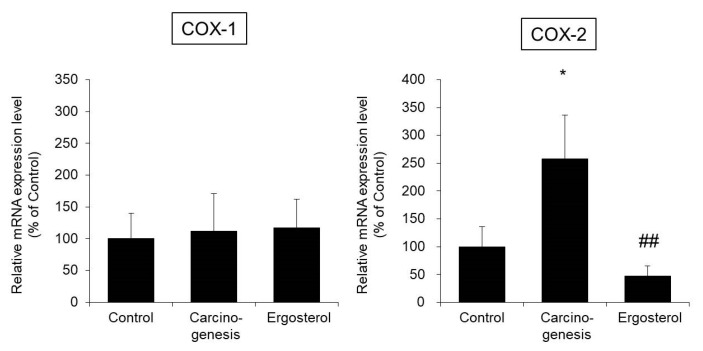
Figure 3.
The mRNA expression levels of cyclooxygenase-1 (COX-1) and cyclooxygenase-2 (COX-2) in bladder epithelial cells. The bladders were removed from rats in the control, carcinogenesis, and ergosterol-treated groups, and the mRNA expression levels of COX-1 and COX-2 were measured using real-time RT-PCR and normalized to those of 18S rRNA. The data are presented as percentages of the mean value in the control group, which was set at 100%. The data show the mean ± SD from five rats per group. Tukey’s test, * p < 0.05 vs. the control group, ## p < 0.01 vs. the carcinogenesis group.

