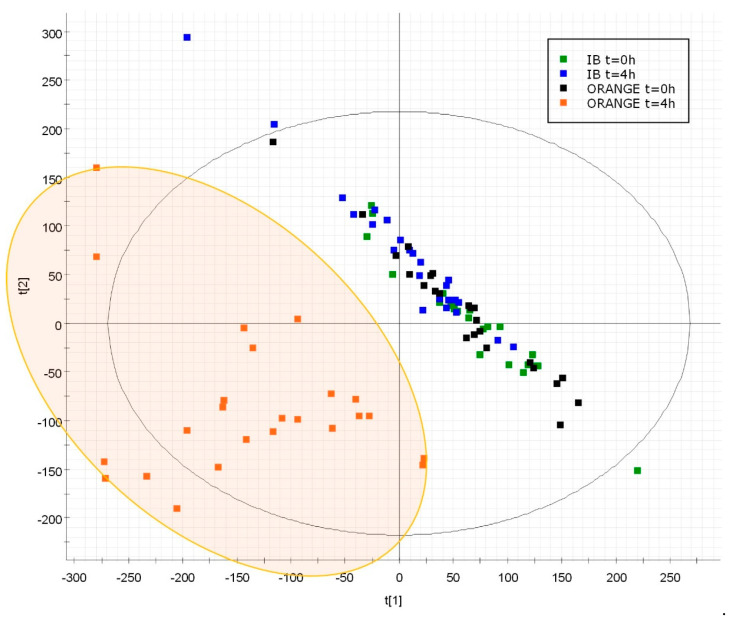
Figure 2.
PLS-DA score plot based on the features with repeated measures ANOVA p-value ≤ 0.05. A 2D vision component 1 vs. component 2 with 24.5% and 13.8% of the variance explained, respectively. The samples obtained at t = 0 h and t = 4 h after the intake of an isocaloric beverage (IB) and the samples obtained at t = 0 h and t = 4 h after orange intake are colored in green, blue, black and orange, respectively.

