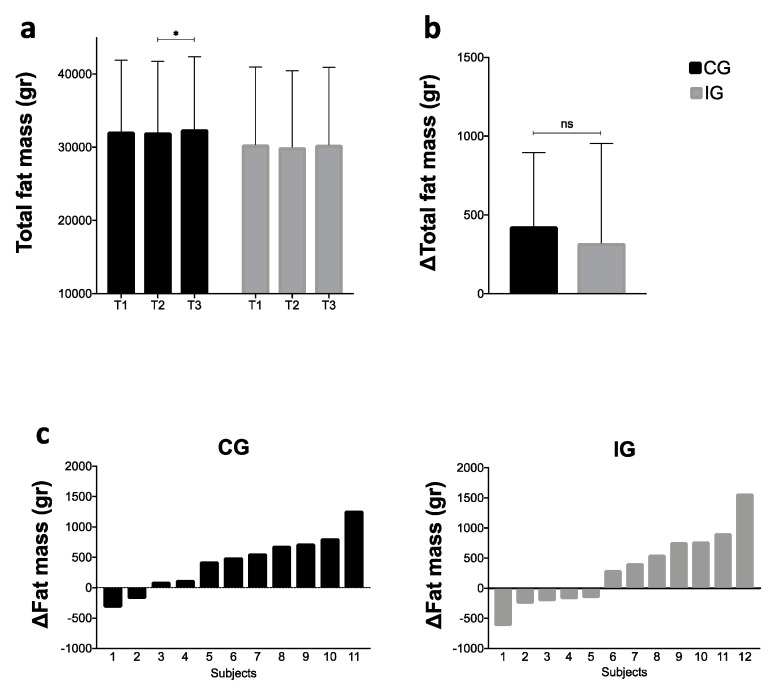
Figure 3.
(a) Intra-group values of total fat mass during T1, T2, and T3; (b) comparison of the total FM variation between groups during the NH (T3−T2); (c) individual fat mass variation during the NH by groups. CG: control group; IG: intervention group; NH: national holidays; * Statistical significance (p < 0.05); NS: no statistical significance.

