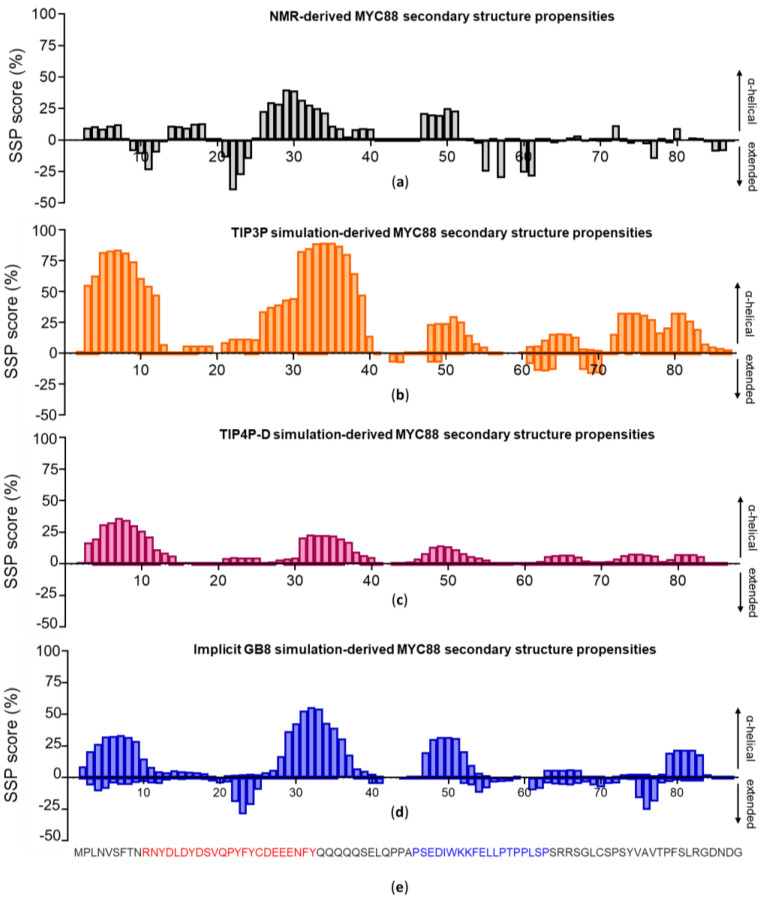
Figure 2.
Comparison of (a) NMR-determined transient secondary structure propensities of c-MYC1-88 with (b) those obtained from the molecular dynamics simulations using the TIP3P solvation method, (c) those obtained from simulations using the TIP4P-D water model and (d) those obtained from the simulations using the implicit generalized Born (GB8) solvation method. The positive values on the Y-axis correspond to regions with a tendency to form α-helices, whilst the negative Y-axis values reflect regions with propensities towards extended structure formation. (e) Sequence of c-MYC1-88 with MYC-boxes MB-0 colored in red and MB-1 in blue.

