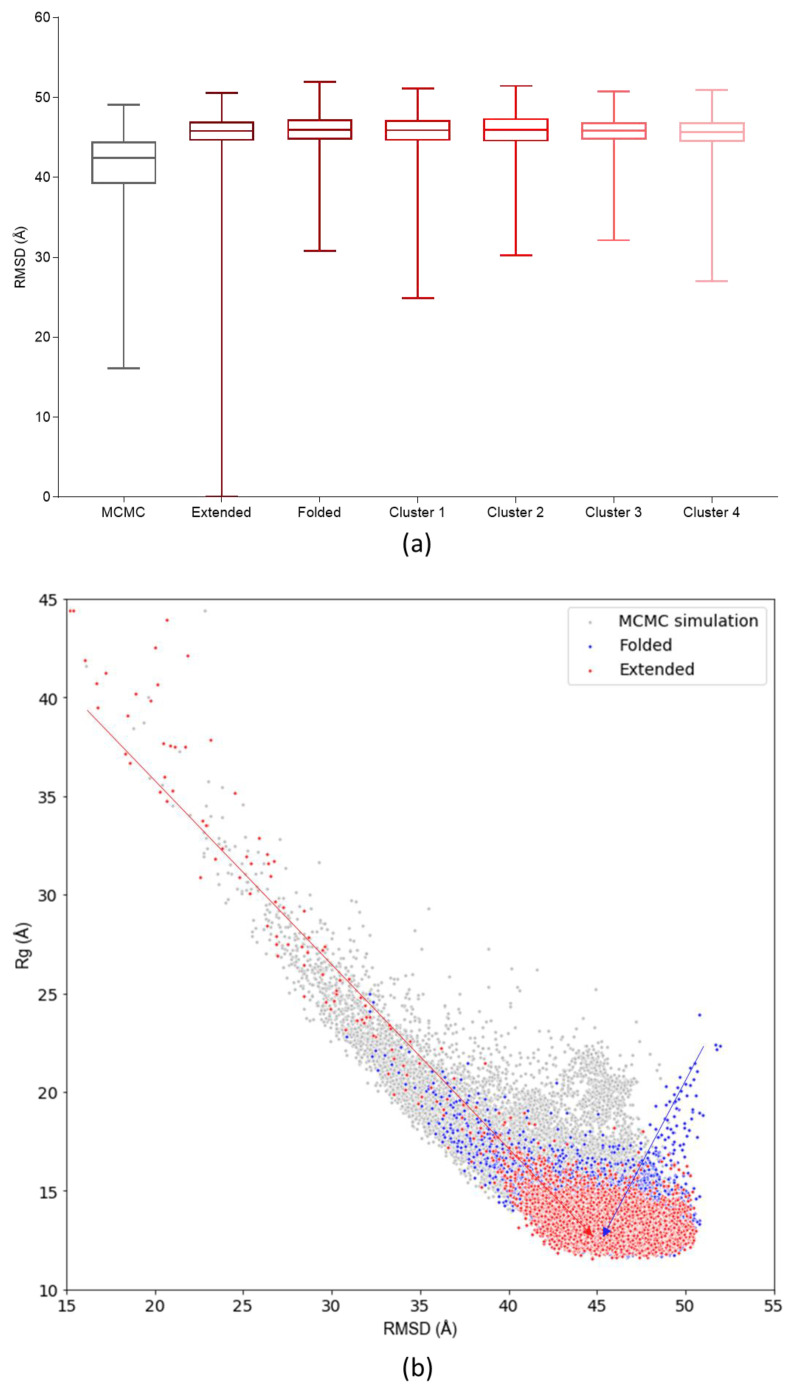
Figure 5.
(a) Boxplots comparing the MCMC RMSD values of the MD simulations parameterized with different starting structures: “Extended” corresponds to fully unstructured initial coordinates; “Folded” to a structure created with an ab initio software; the “Cluster” structures correspond to the different k-means centroids. (b) MCMC conformational landscape compared to MD of c-MYC1-88 simulations starting from fully extended initial coordinates (in red), or from a folded conformation (in blue). The arrows highlight the shortest path from the starting point to the equilibrated conformational pool.

