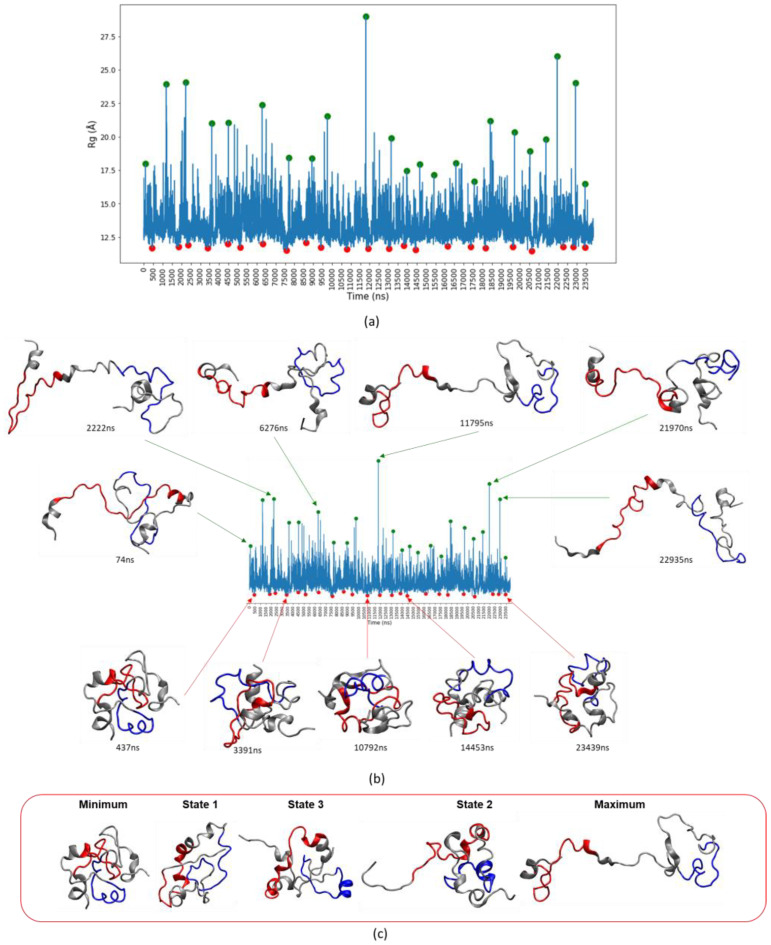
Figure 7.
(a) The Rg values over the course of the trajectory with the identified minima and maxima (identified by red and green dots, respectively). (b) Examples of some of the minima and maxima conformations over time. MB-0 is highlighted in red and MB-1 in blue. (c) Representative structures of c-MYC1-88. The “minimum” and “maximum” structures were derived from the Rg peak detection and were combined with the three states that correspond to the three time-structure independent components analysis (TICA) metastable states.

