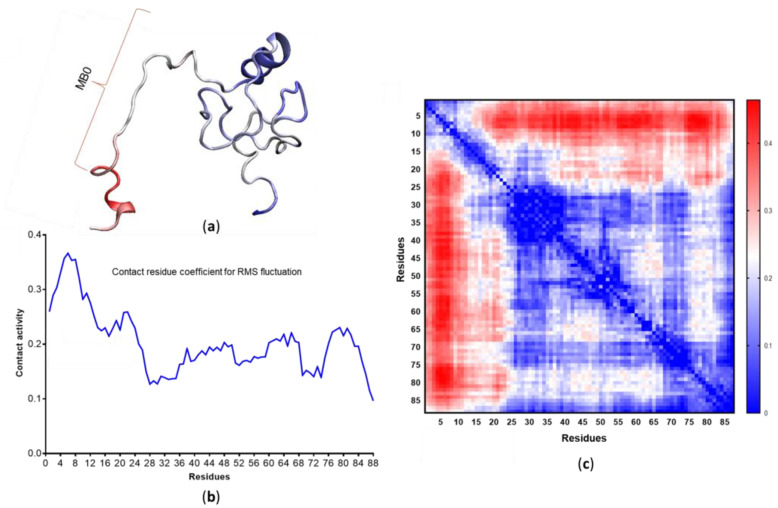
Figure 8.
(a) Contact activity data superimposed on a representative structure. (b) Linear graph containing the contact residue coefficient for root mean square fluctuation per residue. (c) Heat map identifying active versus inactive protein regions according to their contact activity coefficient—blue identifies areas of stability and red identifies areas of increased activity.

