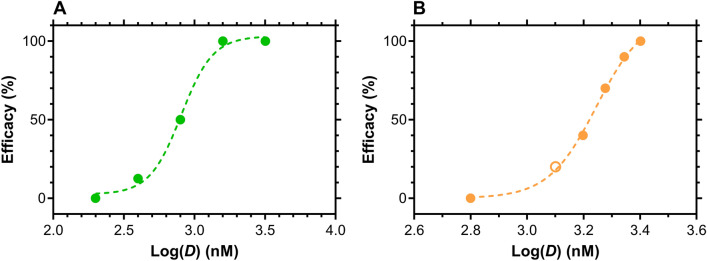
Figure 2.
Dose–response curves for vaginal HIV-1 challenge studies in humanized BLT mice. Plots of efficacy versus dose of (A) VRC01-N (N = 8 per dosing group, 5 groups) and (B) TDF-FTC-VRC01-N combination (N = 10 per dosing group, 5 groups per study; two studies) applied prior to HIV-1 challenge. Open circle corresponds to datapoint from separate experiment. Dashed lines are fits to a sigmoidal dose–response (variable slope) model used to calculate EC50 of the drug or drug combination providing protection against vaginal HIV-1 challenges.

