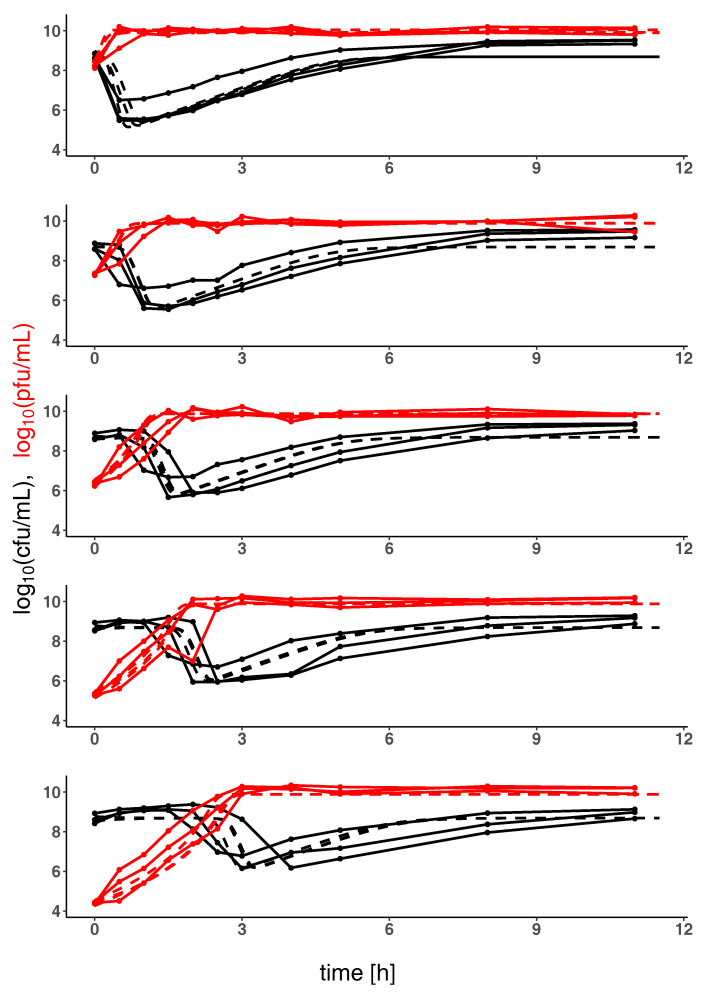
Figure 2.
Kinetic profile showing population sizes of K. pneumoniae and of phage vB_KpnP_Lessing over time: The evolution of K. pneumoniae and the corresponding phage vB_KpnP_Lessing population sizes (in colony forming units (solid black lines, cfu mL) and plaque forming units (solid red lines, pfu mL)) over time (in hours) is shown in combination with the model prediction (for each experimental replicate, dashed lines). Kinetic profiles are shown for five different initial phage population sizes (decreasing from top to bottom) and for estimated optimal parameters listed in Table 1.

