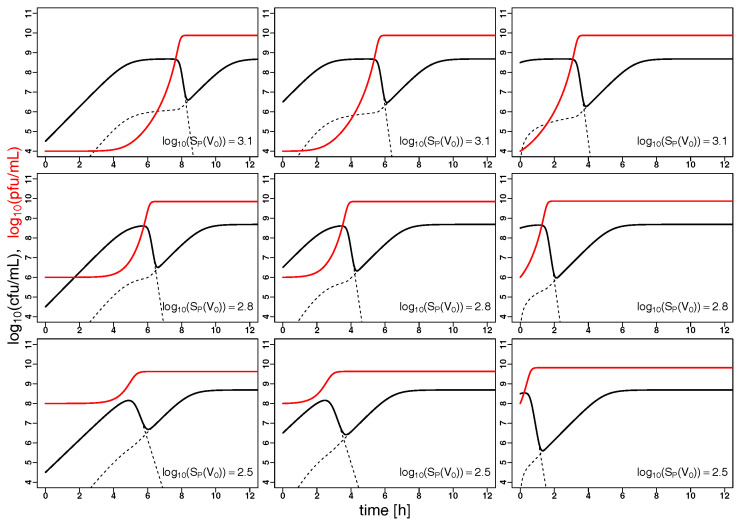
Figure 3.
Phage synergy leads to fast bacterial depletion: The evolution of K. pneumoniae (solid black) and the corresponding phage vB_KpnP_Lessing (solid red) population sizes (in colony forming units (cfu mL) and plaque forming units (pfu mL)) over time (in hours) is extrapolated from the model based on the optimal parameters listed in Table 1 with varying starting concentrations, the right column corresponds to the setting in Figure 2. Dashed black lines correspond to the population sizes of sensitive and resistant bacteria. In all panels, the initial phage concentrations are below the inundation threshold (cf. Equation (4)), i.e., the minimal phage concentration required for a decline in sensitive bacteria. However, the initial concentrations of sensitive bacteria always exceed the proliferation threshold (cf. Equation (5)), i.e., the phage populations are growing.

