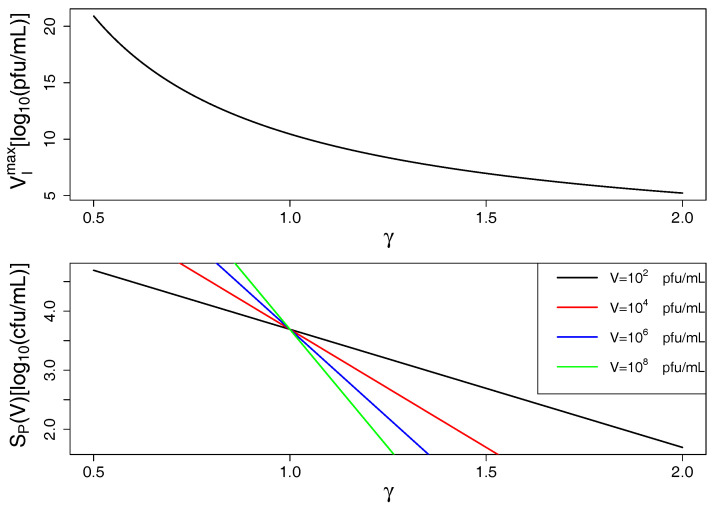
Figure 4.
Inundation and proliferation thresholds decrease with growing (i.e., growing phage synergy): In the top panel, is plotted over (cf. Equation (4)) showing that smaller phage concentrations are sufficient to induce bacterial decline with growing phage synergy. In the bottom panel, is plotted over (cf. Equation (5)) showing that phages can proliferate on smaller bacterial populations with growing phage synergy (also depending on phage population size V). Model predictions are based on optimal parameters from Table 1.

