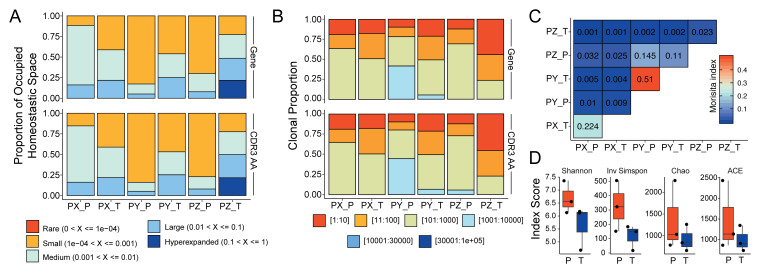
Figure 3. Advanced clonal measures between samples.
( A) Clonal homeostatic space representations across all six samples using the gene and CDR3 AA sequence for clonotype calling. ( B) Relative proportional space occupied by specific clonotypes across all six samples using the gene and CDR3 AA sequence for clonotype calling. ( C) Morisita overlap quantifications for clonotypes across all six samples. ( D) Diversity measures based on clonotypes by sample type using Shannon, Inverse Simpson, Chao, and abundance-based coverage estimator (ACE) indices.

