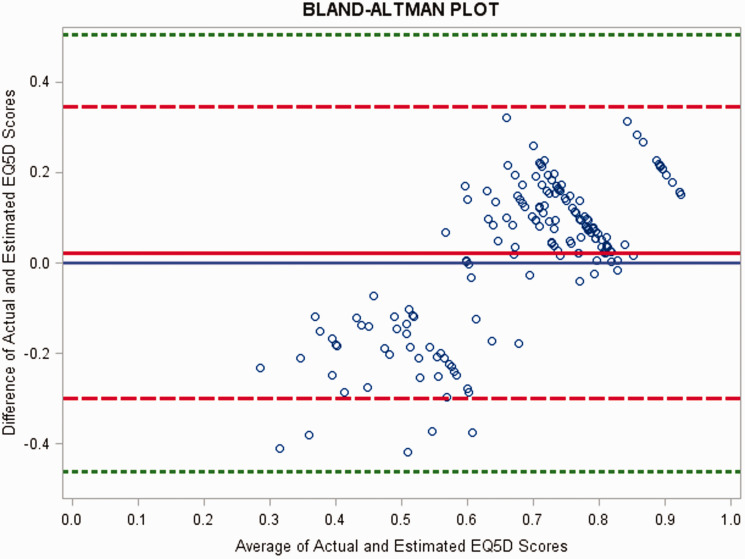
Figure 2.
Plot demonstrating the difference between the actual EQ-5D score and the estimated EQ-5D score from PROMIS (vertical axis) and the average of actual EQ-5D score and the estimated EQ-5D score (horizontal axis). Each dot represents one respondent. The blue lines are the lower and upper 95% limits of agreement, and the red lines are the lower and upper 95% confidence interval for the lower and upper limits.

