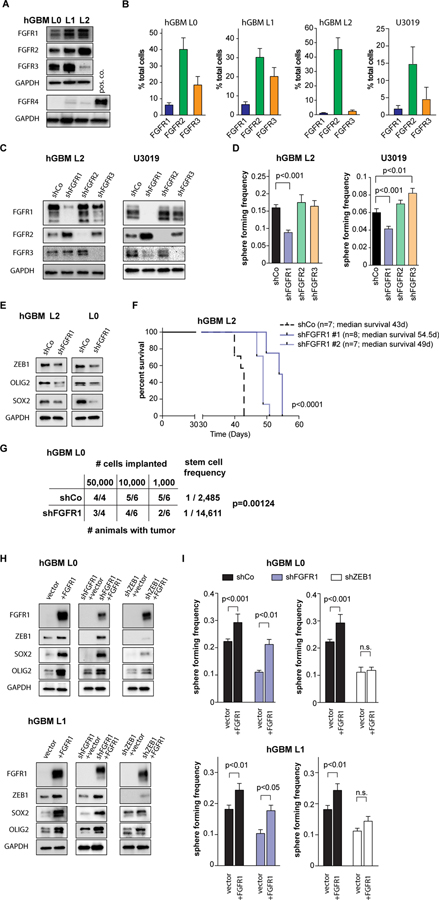
Figure 4: FGFR1 promotes stemness in GBM.
(A) Western blotting shows expression of FGFR1–3, but not FGFR-4 in primary patient-derived GBM cell lines (hGBM L0, L1, L2). (B) Flow cytometry quantification of FGFR1–3 expression in patient-derived human GBM lines (n=3 independent experiments/sample). Note that FGFR1 is expressed in a small subset of each line. (C) Knockdown of FGFR1–3 using shRNA constructs shows specificity for each receptor. Additional constructs are shown in Fig. S5. (D) Knockdown of FGFR1, but not FGFR2 or FGFR3, results in decreased sphere-forming frequency compared to control cells (hGBM L2 n=6, U3019 n=9, one-way ANOVA). (E) FGFR1 knockdown decreases expression of ZEB1, SOX2 and OLIG2 in GSCs. (F) Orthotopic implantation of FGFR1 knockdown cells significantly increases survival of tumor-bearing animals (median survival shCo: 43d, shFGFR1#1: 54.5d, shFGFR1#2: 49d; log-rank test). (G) Limiting-dilution orthotopic implantation reveals FGFR1 knockdown reduces tumorigenic potential. Stem cell frequency was calculated using ELDA (Chi square test). (H) Expression of full-length FGFR1 increases ZEB1 expression in control cells, and rescues ZEB1 expression in FGFR1 knockdown cells. (I) Full-length FGFR1 expression increases sphere-forming frequency in control cells (black bars), and rescues sphere-forming frequency of FGFR1 knockdown cells to control levels (blue bars). Knockdown of ZEB1 negates the effect of FGFR1 expression (white bars) (n=9, two-way ANOVA).

