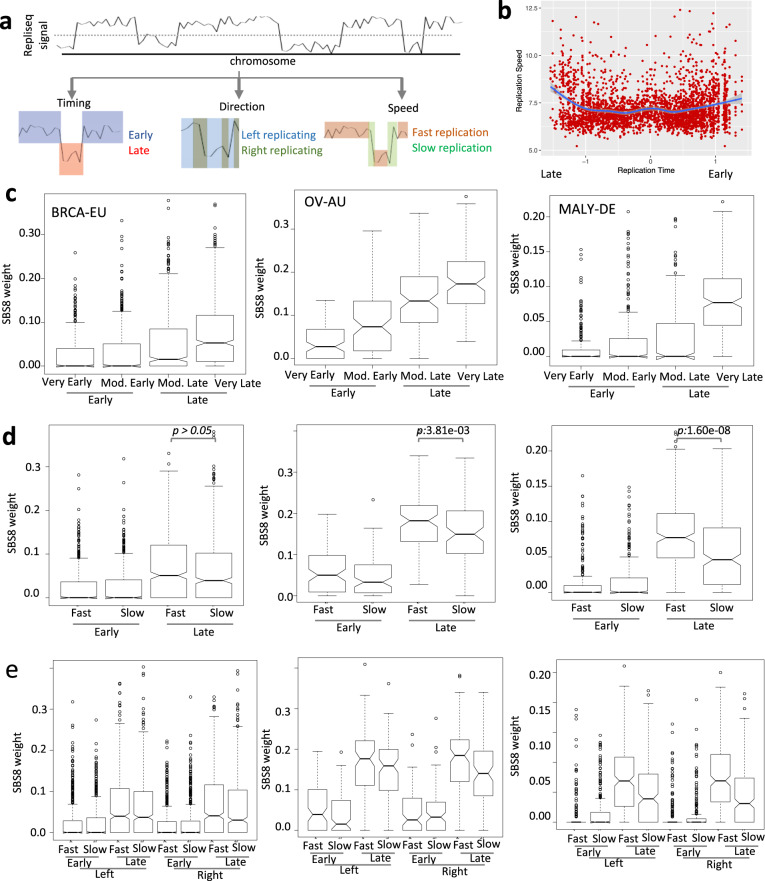
Fig. 3. Replication context analysis of SBS8.
a Schematic representation of inference of replication timing, direction of fork progression, and replication speed from repliseq data. b Scatterplot showing changes in replication speed with replication timing in MCF7 breast cancer cell line, which shows an increase in replication speed late during replication. Similar results are observed for other cell lines. c Boxplot showing distributions of weight of Signature 8 in replication timing contexts in breast cancer (BRCA-EU), ovarian cancer (OV-AU), and lymphoma (MALY-DE). d Boxplot showing distributions of weight of Signature 8 in combinations of replication timing and speed contexts in breast cancer (BRCA-EU), ovarian cancer (OV-AU), and lymphoma (MALY-DE). p Values for comparisons between fast and slow replication speed in late replication contexts are listed; combined p value for the three cohorts using Fishers method is 3.45e−09. e Boxplot showing distributions of weight of Signature 8 in combinations of replication timing, speed, and direction contexts in breast cancer (BRCA-EU), ovarian cancer (OV-AU), and lymphoma (MALY-DE). See Supplementary Fig. 3 for similar results for other cancer cohorts. p Values for comparisons between left and right replication direction were not significant, when analyzed in the context of combinations of replication timing and speed in the cohorts. See Supplementary Data 1 for description of the cancer cohorts including the number of samples.

