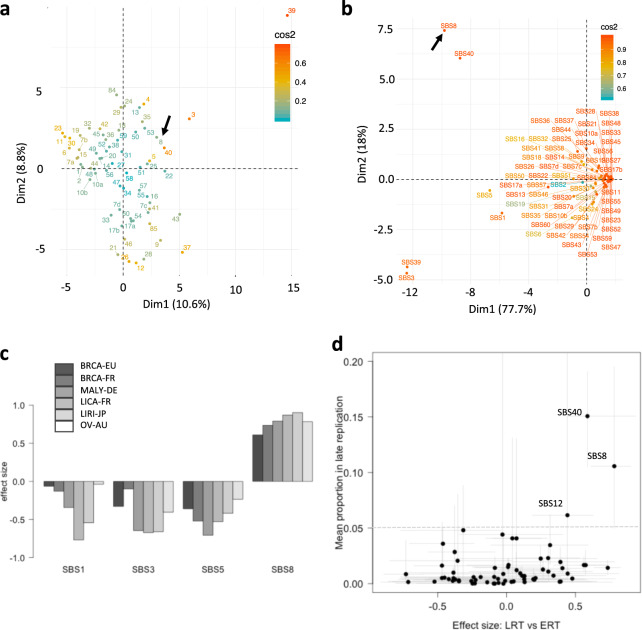
Fig. 4. Crosstalk between SBS8 and other mutational signatures.
a PCA plot showing different mutational signatures projected based on their trinucleotide frequencies. Cosine similarity is shown to the right. b PCA plot showing different mutational signatures projected based on their weights in different epigenomic contexts. SBS8 is marked with an arrow. Cosine similarity is shown to the right. c Effect size of selected mutational signatures SBS1, SBS3, SBS5, and SBS8 in late replication contexts relative to early replication contexts in different cohorts. Negative values indicate preferential occurrence in early replication contexts. d Scatterplot showing mean proportion of each signature in late replication against its effect size between early and late replication contexts. SBS8, SBS40, and SBS12 are marked. Whiskers indicate the maximum and minimum values across the cancer cohorts. See Supplementary Data 1 for description of the cancer cohorts including the number of samples.

