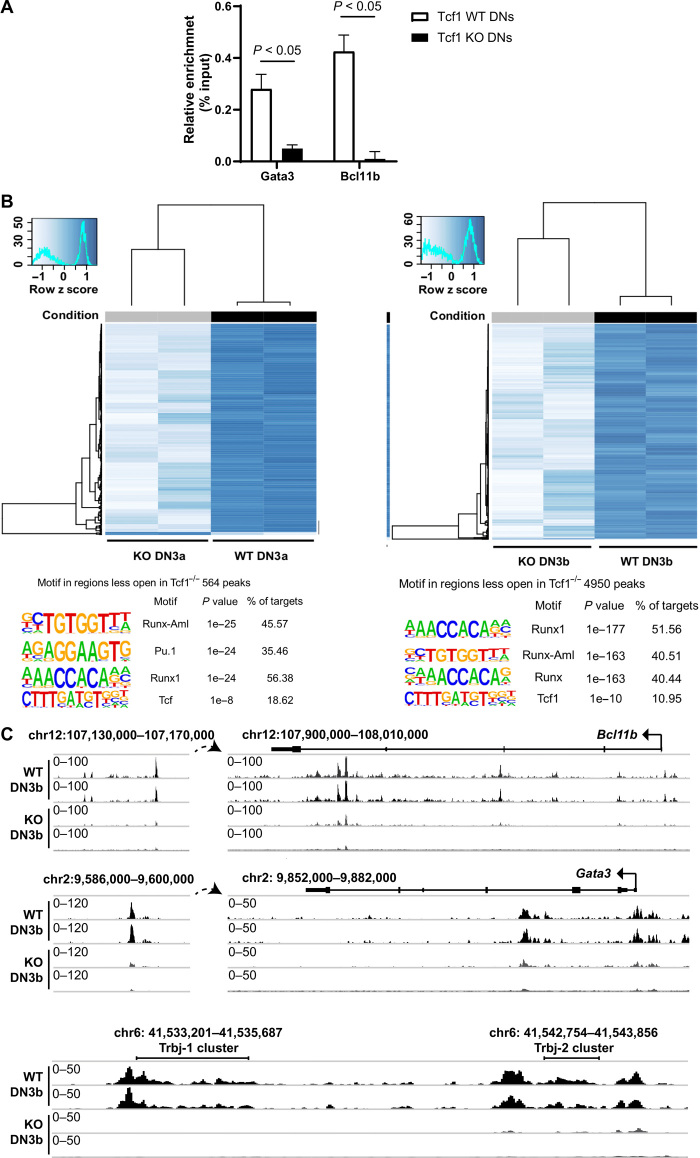
Fig. 2. Chromatin accessibility analysis in Tcf1-deficient versus WT DN thymocytes.
(A) Chromatin immunoprecipitation with an antibody specific for Tcf1 revealed that the Gata3 promoter and the Bcl11b enhancer are occupied by Tcf1 in vivo, whereas in Tcf1 KO DN thymocytes, no binding can be detected. Negative controls with IgG instead of anti-Tcf1 showed no enrichment. (Multiple t test. Error bars represent the SD of at least three pooled mice and from two independent experiments.) (B) Heat map of DESeq2 normalized read counts of ATAC-seq shows differentially accessible regions between WT and Tcf1−/− in DN3a and DN3b. Motif analysis was performed in the differentially accessible regions using HOMER showing the three highest scores and Tcf1 score. (C) ATAC-seq data mined for the Bcl11b, Gata3, and Trbj (T cell Receptor Beta) genomic regions. Per locus, the relative abundance of transposase accessible regions is indicated. The individual ATAC-seq profile from each genotype is shown. Data are shown as normalized read density.

