
Fig. 2.
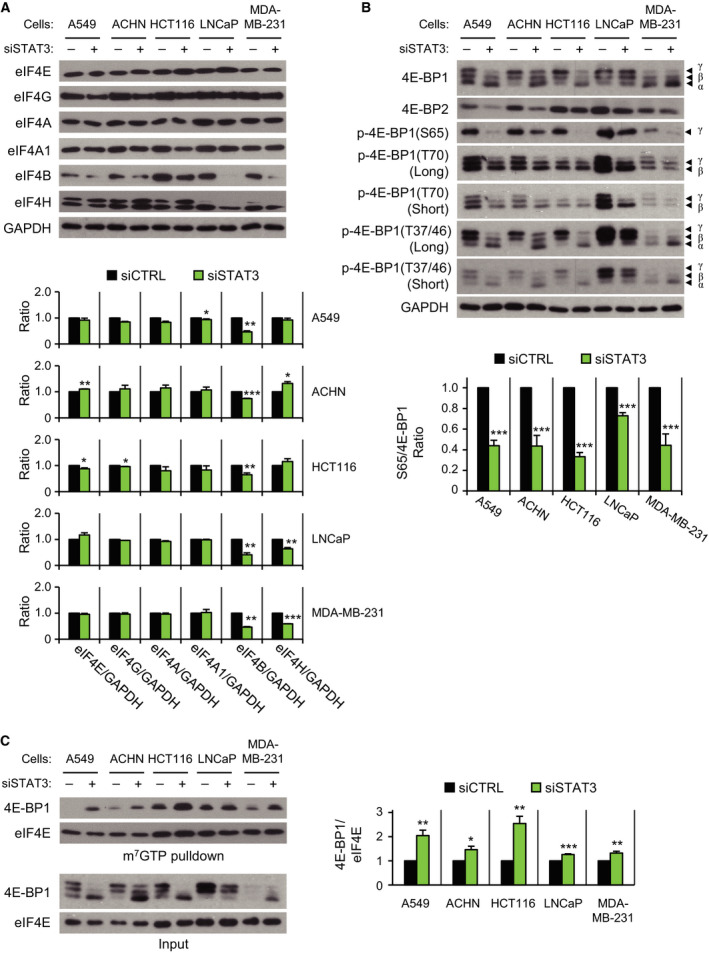
STAT3 knockdown‐induced change in factors related to cap‐dependent translation initiation. Cancer cells were treated with 5 nm of siCTRL (−) or siSTAT3 (+) for 72 h. (A, B) Western blotting was performed using indicated antibodies (top). The band intensity of siSTAT3 group was normalized to that of siCTRL group in each cell line (bottom; n = 2–6). Long, long exposure; Short, short exposure. (C) Cell lysates were precipitated with m7GTP agarose beads, and eluted complexes were analyzed by western blotting with the antibodies indicated (left). The relative intensity of 4E‐BP1 to eIF4E of siSTAT3 group was compared with that of siCTRL group in each cell line (right; n = 4). Data are presented as mean ± SEM. Statistically significant differences are marked with *P < 0.05, **P < 0.01, and ***P < 0.001, respectively (t‐test).