Fig. 7.

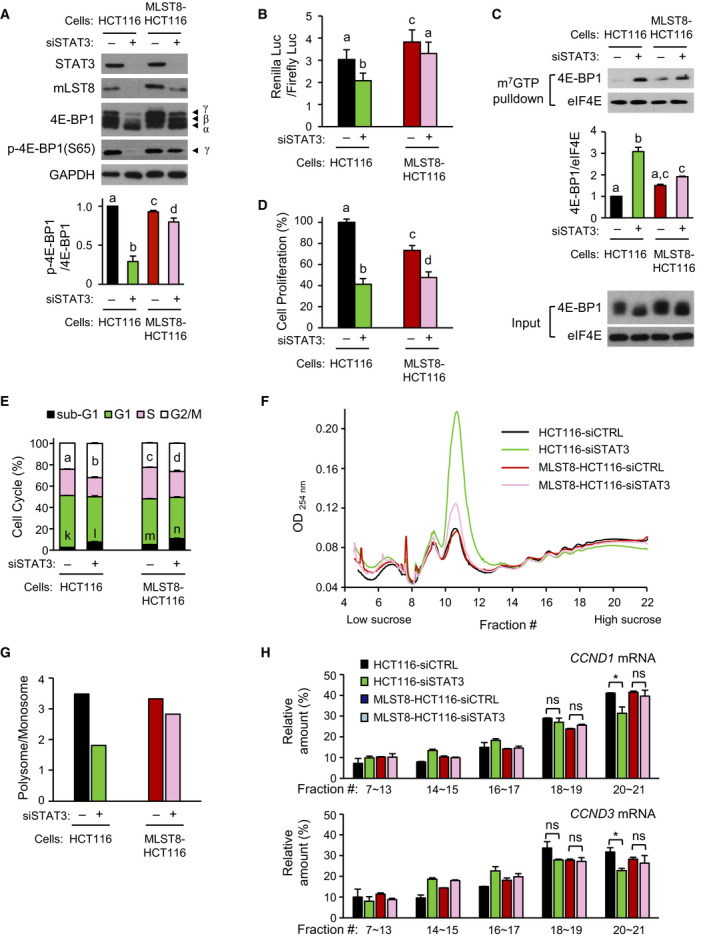
Amelioration of cap‐dependent translation in mLST8‐overexpressed HCT116 cells. (A) siSTAT3 were transfected into control HCT116 and MLST8‐HCT116 cells for 72 h. Western blotting was performed using equal amounts of extracts with indicated antibodies, and the band intensity of phospho‐4E‐BP1(S65; bottom) was quantified (n = 4). (B) siSTAT3 were transfected into cells for 48 h followed by secondary transfection of cells with the bicistronic luciferase reporter for 24 h. Cap‐dependent translational activity of each group was compared with siCTRL group using dual‐luciferase assay (n = 4). (C) m7GTP pull‐down extract was detected by western blotting using indicated antibodies, and the cap‐binding 4E‐BP1 index was determined by the ratio of 4E‐BP1 to eIF4E (bottom; n = 3). (D) Relative cell proliferation was determined by counting the viable cells (n = 3). (E) Cell cycle distribution was analyzed by FACS (n = 3). (F) Cell extract was obtained after 48 h of treatment with 2 nm siRNA, and polysome fractionation was performed. Elution profile was shown by reading absorbance readings at 254 nm. (G) Relative polysome‐to‐monosome ratios in F are shown. (H) RNA was extracted by pooling each fraction as indicated (#7–#13, monosome; #14–#21, polysome), and relative amounts of mRNA in fractions were expressed when the total fractions of CCND1 and CCND3 mRNA were 100% using qRT–PCR (n = 2). The RNA difference in each fraction was normalized using the value of RNA polymerase II (POLR2A) mRNA. Data are presented as mean ± SEM. Statistically significant differences are marked with different letters (A–E; for E, a–d for G2/M; k–n for sub‐G1; P < 0.05) or with *P < 0.05; ns, statistically insignificant, two‐way ANOVA.
