Fig. 2.

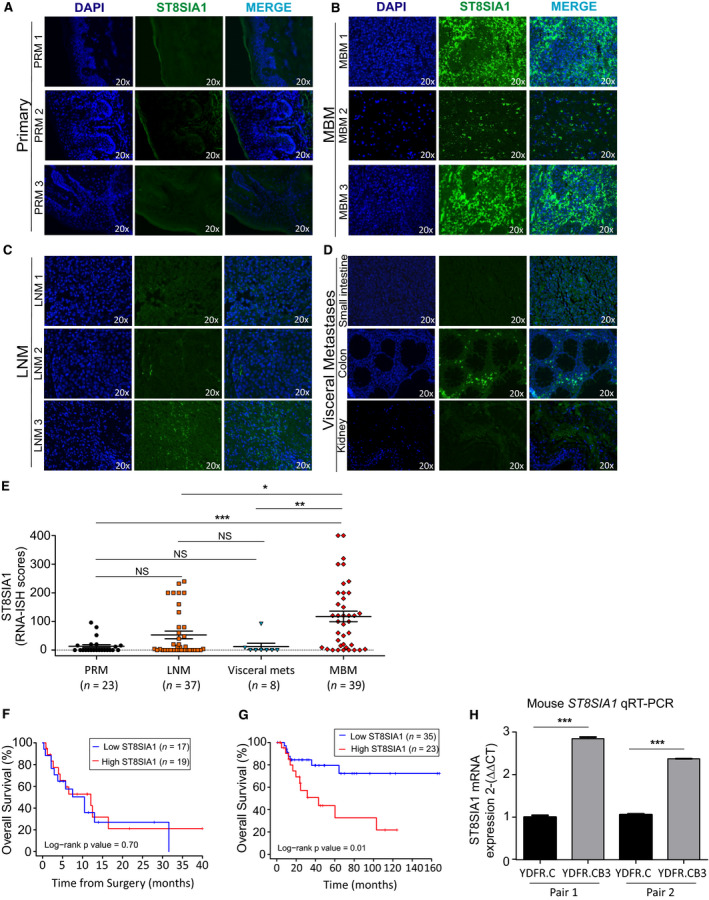
Profile and prognostic values of ST8SIA1 expression in LNM and MBM. (A–E). FFPE tissue sections from melanoma patients were stained with ST8SIA1 probe for RNA‐ISH and assessed by immunofluorescence. Representative images are shown for ST8SIA1 expression; DAPI (blue), ST8SIA1 (green), and Merge in PRM (A), MBM (B), LNM (C), and various visceral metastases (small intestine, colon, and kidney) (D). (E). ST8SIA1 RNA‐ISH scores (0–400) in PRM (n = 23), LNM (n = 37), visceral metastasis (n = 8), and MBM (n = 39). (F). Kaplan–Meier curve comparing OS for MBM patients with high and low ST8SIA1 expression based on median cutoff of RNA‐ISH scores. (G). Kaplan–Meier curve comparing OS for patients with high and low ST8SIA1 expression (z‐score cutoff = 0.31, n = 58). (H). qRT‐PCR analysis of ST8SIA1 expression in paired tissue from PRM tumors (YDFR.C) and MBM (YDFR.CB3) derived from xenograft mouse model. Error bars represent means ± SD of three replicates (t‐test; NS: not significant, *P < 0.05, **P < 0.01, ***P < 0.001).
