Fig. 5.

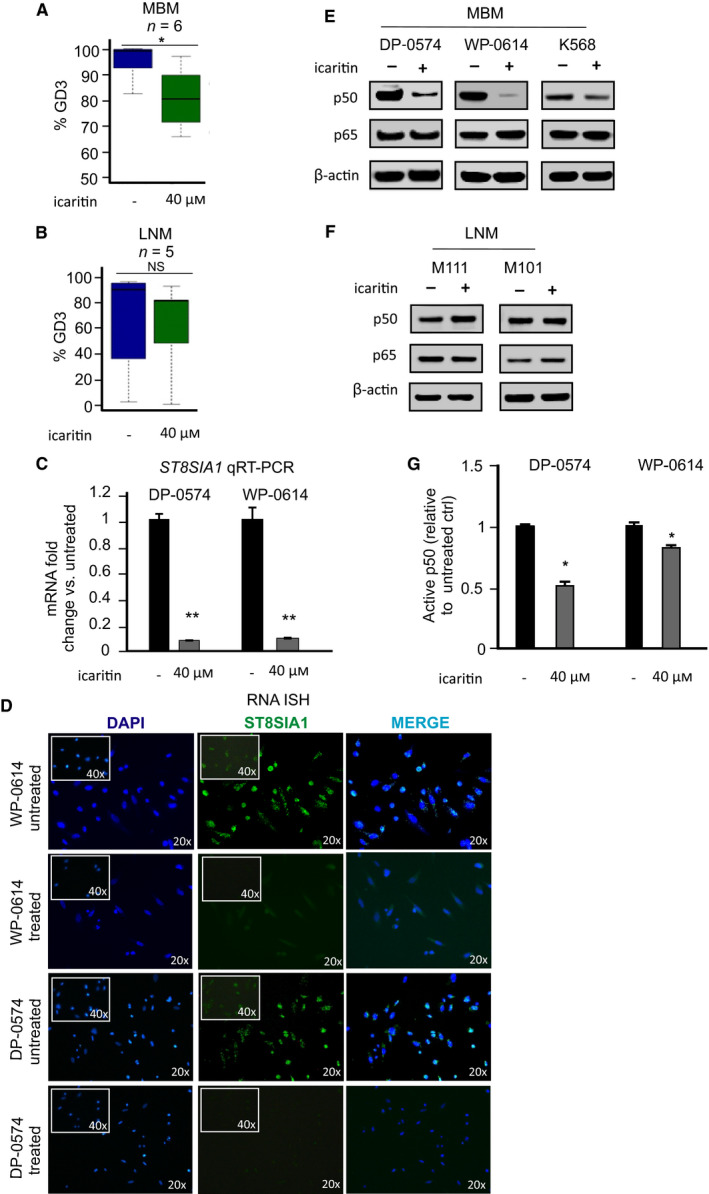
Assessment of GD3 and ST8SIA1 expression after icaritin treatment of MBM cells. (A, B). MBM (n = 6) and LNM (n = 5) cells were treated 72 h with or without icaritin (40 µm). After 72‐h treatment incubation, cells were harvested and GD3 expression was assessed in MBM (A) and LNM (B) cells by FACS. (C). ST8SIA1 expression was determined by qRT‐PCR in untreated and icaritin‐treated cells. (D). Cells were seeded into and grown in 8‐well chambered slides overnight. Cells were fixed and stained for ST8SIA1 using immunofluorescent probes by RNA‐ISH. ST8SIA1 expression in untreated versus icaritin‐treated cell lines is shown. (E, F). Cells were treated with icaritin (40 µm) or left untreated for 72 h. Cells were harvested, and total protein was extracted. The p50 and p65 levels in MBM (E) and LNM (F) cells were assessed by western blot. (G). Cells were treated with or without icaritin (40 µm) for 72 h, and nuclear extracts were isolated. Transactivation assay was performed to detect p50 active form. Error bars represent means ± SD from replicates (n = 3) (t‐test, NS: not significant, *P < 0.05, **P < 0.01, ***P < 0.001).
