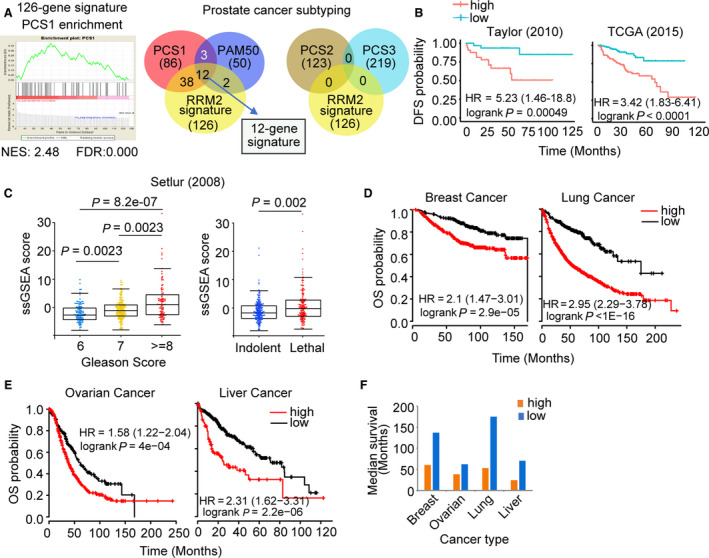
Fig. 4.

Clinical significance of the 12‐gene RRM2 subsignature. (A) GSEA plot (left) shows high enrichment of PCS1 genes in the RRM2 signature. Venn diagrams (right) depict the overlap between genes in the RRM2 signature with PCS1 and PAM50 genes (left) and PCS2 and PCS3 genes (right). The 12 genes shared by PCS1, PAM50, and RRM2 signature comprise the 12‐gene subsignature. (B) Correlation of expression of the 12‐gene signature with DFS in the Taylor (left) and TCGA (right) cohorts. (C) Correlation of the 12‐gene signature ssGSEA score with Gleason score (left) and lethality (right) in the Setlur cohort. (D) Correlation between 12‐gene signature expression and probability of overall survival (OS) was analyzed in breast and lung cancer and (E) ovarian and liver cancer. Samples were ranked based on expression of the 12‐gene subsignature, and Kaplan–Meier curves were used to estimate survival differences between patients in the top and bottom 25th percentiles of expression. The log‐rank test was calculated to determine significance. Cox proportional hazard regression was performed, adjusting for clinical and demographic factors. Significance was determined using Wilcoxon's rank‐sum test. (F) Median survival time was compared between cases with low (blue) or high (orange) expression of the 12‐gene panel.
