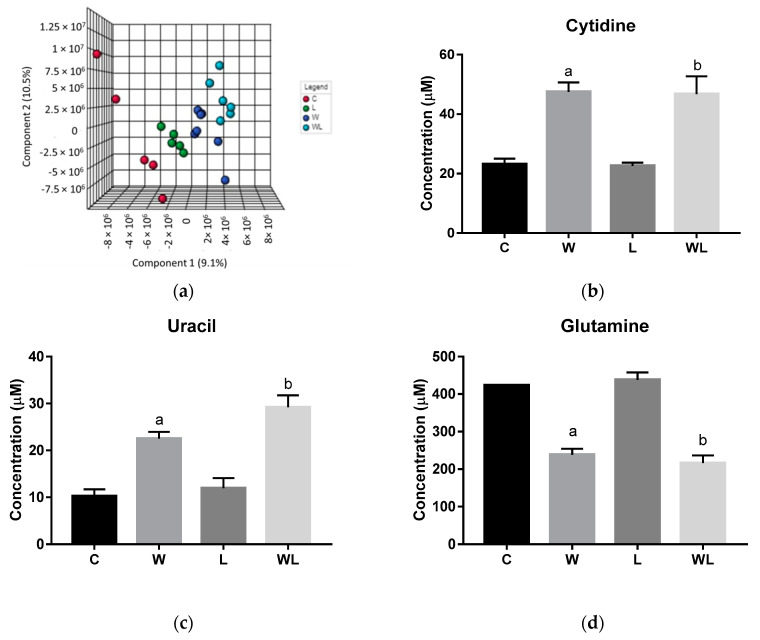
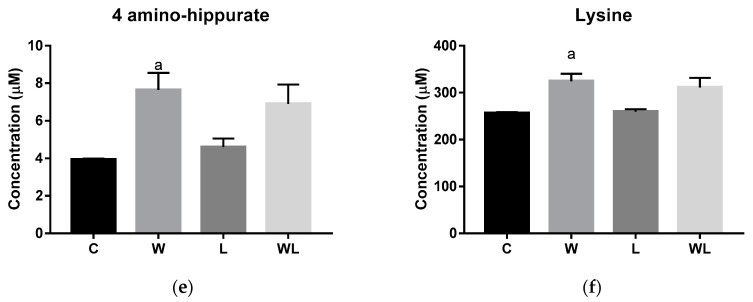
Figure 1.
Results obtained from serum samples: (a) serum PLS-DA plot score; serum quantified metabolites, as normalized concentrations (µM); (b) cytidine; (c) uracil; (d) glutamine; (e) 4-aminohippurate, and (f) lysine. Legend: C, Control group (n = 5); W, Tumor-bearing group (n = 5); L, Group without tumors and with a maternal leucine-rich diet (n = 6); WL, Tumor-bearing group with a maternal leucine-rich diet (n = 6). For more details, see Material and Method section. a, p < 0.05 for statistical difference compared to C group; b, p < 0.05 for statistical difference compared to L group.


