
Fig. 3.
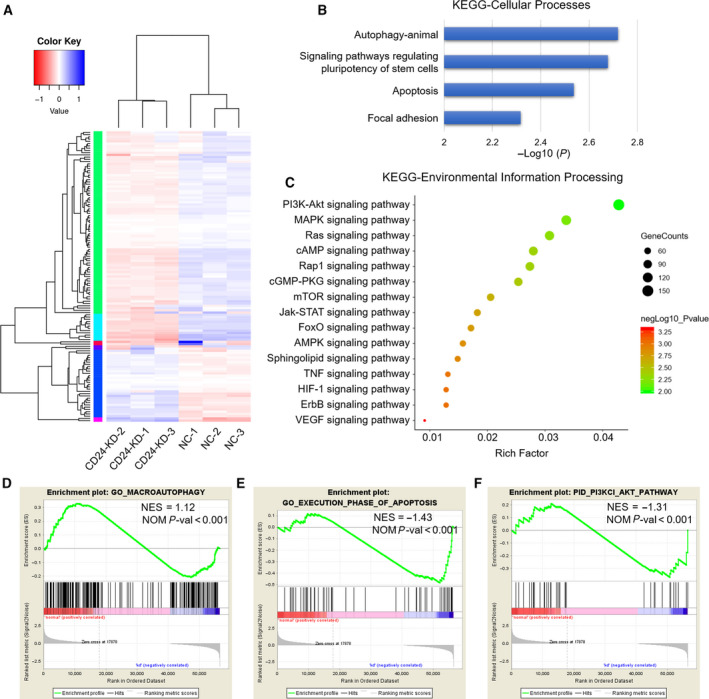
Comparative transcriptome analysis of CD24 KD and control RB cells. (A) Heatmap representation of the significantly DEGs from RNA‐seq data after treatment with VCR (60 nm) for 48 h. (B) KEGG pathway significant enrichment analysis for DEGs in the Cellular Processes category. (C) KEGG pathway significant enrichment analysis for DEGs in the Environmental Information Processing category. The horizontal axis indicates rich factor, and vertical ordinates are the terms of the KEGG pathways. The bubble size shows the number of DEGs, and the color of the bubble represents −log10(P value): Logarithmic conversion of Fisher's exact test P value. (D) GSEA of the ‘GO MACROAUTOPHAGY’ gene set. (E) GSEA of the ‘GO EXECUTION PHASE OF APOPTOSIS’ gene set. (F) GSEA of the ‘PID PI3KCI AKT PATHWAY’ gene set.