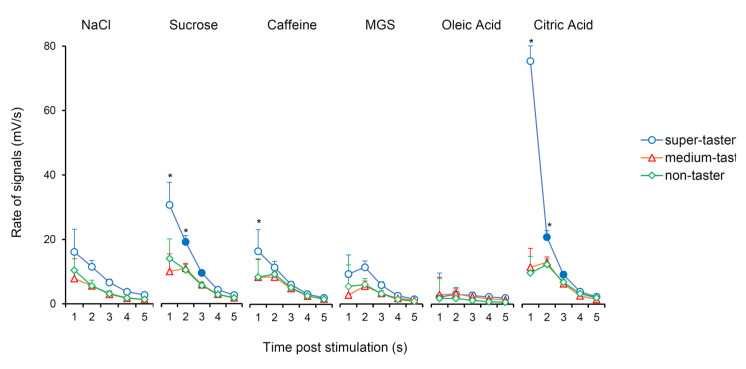
Figure 5.
Time course of potential change rate (mV/s) of bioelectrical signals in response to taste stimulation with six taste qualities according to PROP taster status. Data (mean values ± SEM) determined after 0.1, 2.5, 5, 10, and 15 s after application of taste stimulation. n = 10 super-tasters, n = 15 medium tasters, and n = 14 non-tasters. Numbers 1, 2, 3, 4, 5 on the X-axis correspond to 0.1, 2.5, 5, 10, 15 s after stimulation, respectively. Solid symbol indicates significant difference with respect to the previous value of the corresponding group (p ≤ 0.0099; Fisher LDS, subsequent to repeated-measures ANOVA). * Indicates a significant difference with respects to the corresponding values of other taster groups (p ≤ 0.0427; Fisher LDS, subsequent to repeated-measures ANOVA).

