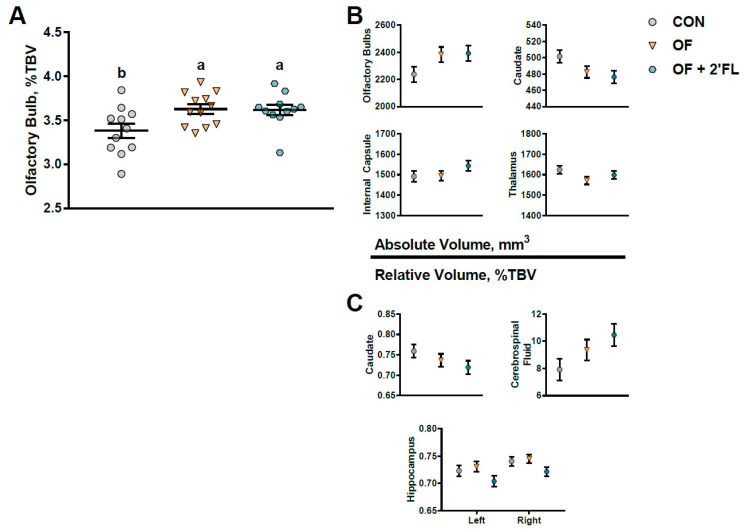
Figure 5.
(A) Both the OF and OF + 2′-FL groups demonstrated larger relative volumes of the olfactory bulbs (p = 0.019) as compared to controls. (B) Trending effects of diet are shown for both absolute and (C) relative brain volumes (0.05 < p < 0.10). Lines depict the mean ± standard error, and groups without a common superscript differ (p < 0.05). Abbreviations: CON, control group; OF, pigs fed oligofructose; OF + 2′-FL, pigs fed oligofructose and 2′ fucosyllactose; %TBV, percent of total brain volume.

