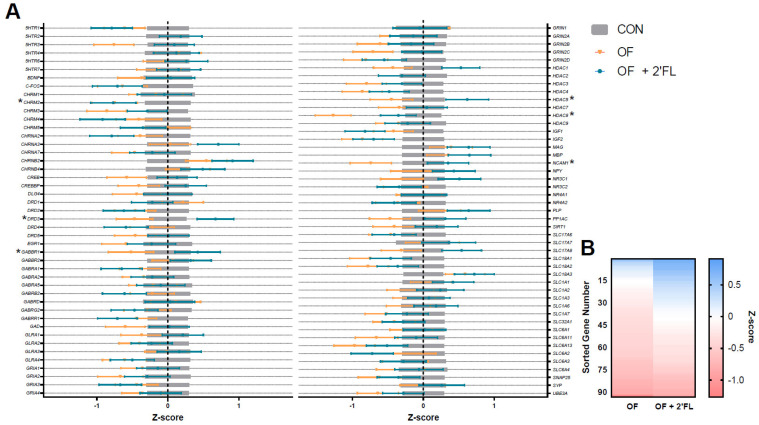
Figure 6.
Hippocampal tissue was assessed for the mRNA expression of 93 genes. (A) Figure depicts standardized data (mean = 0, standard deviation = 1) centered by control group. Values below zero indicate decreased expression compared to control, whereas values above zero indicate increased expression. Bars show the mean + standard error, and genes significantly impacted by diet are denoted by an asterisk. Accession numbers for each gene can be found in Supplemental Table S7. (B) Genes were sorted in descending order by Z-score for each diet, visualizing the abundance of downregulated gene products in the OF group compared to the OF + 2′-FL group. Abbreviations: CON, control group; OF, pigs fed oligofructose; OF + 2′-FL, pigs fed oligofructose and 2′ fucosyllactose.

