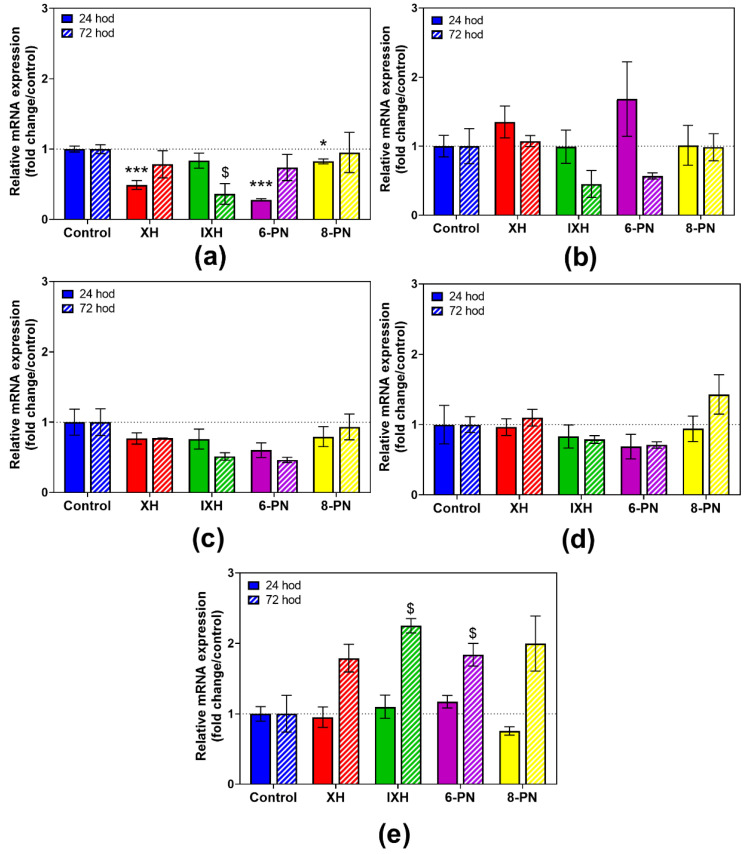
Figure 3.
The effect of prenylflavonoids (1 µM) on the normalized mRNA expression of GSTA1/2 (a), GSTP1 (b), SULT1A1 (c), COMT (d) and UGT1A6 (e) in differentiated CaCo-2 cells after 24 h and 72 h (n = 3). The normalized expression level was calculated using the 2−ΔΔCt method with the geometric mean of GAPDH and B2M as a reference gene. Results are presented as the mean ± SD of 3 independent experiments. Statistical analyses were performed using a one-way ANOVA with Dunnett’s test: p < 0.05 (* or §), p < 0.001 (***); * different from control after 24 h, $ different from control after 72 h.

