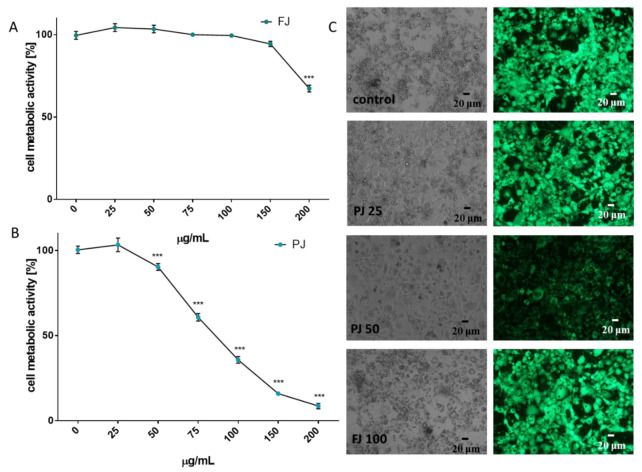
Figure 3.
The influence of V. opulus FJ and PJ on 3T3L-1 cell metabolic activity determined by the PrestoBlue assay after 48 h exposure of FJ (A) and PJ (B); control cells were not exposed to any compound; values are means ± standard deviations from at least three independent experiments, n ≥ 12; statistical significance was calculated versus control cells (untreated), *** p ≤ 0.001. Morphology of 3T3L1 cells observed on the 5th day of the cell differentiation process (C) with 25 and 50 μg/mL of PJ, and 100 μg/mL of FJ; randomly chosen fields were photographed at × 200 phase-contrast and a fluorescent microscope (cells stained with 2 µM calcein AM).

