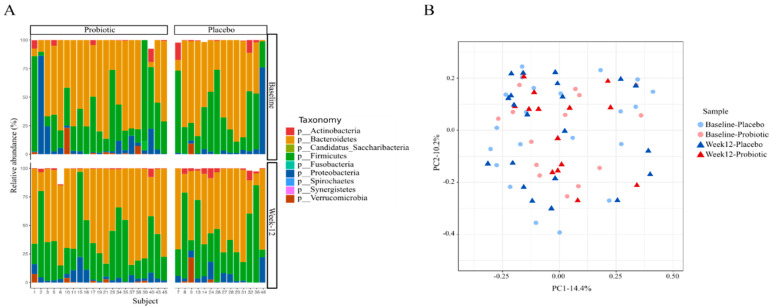
Figure 2.
Shift in intestinal microbial profile after the 12-week intervention. (A) Microbial profile at the phylum level in each groups and timeline. (B) Principal coordinate analysis (PCoA) of Bray–Curtis distances at the species level between the intestinal microbial communities of subjects in each group.

