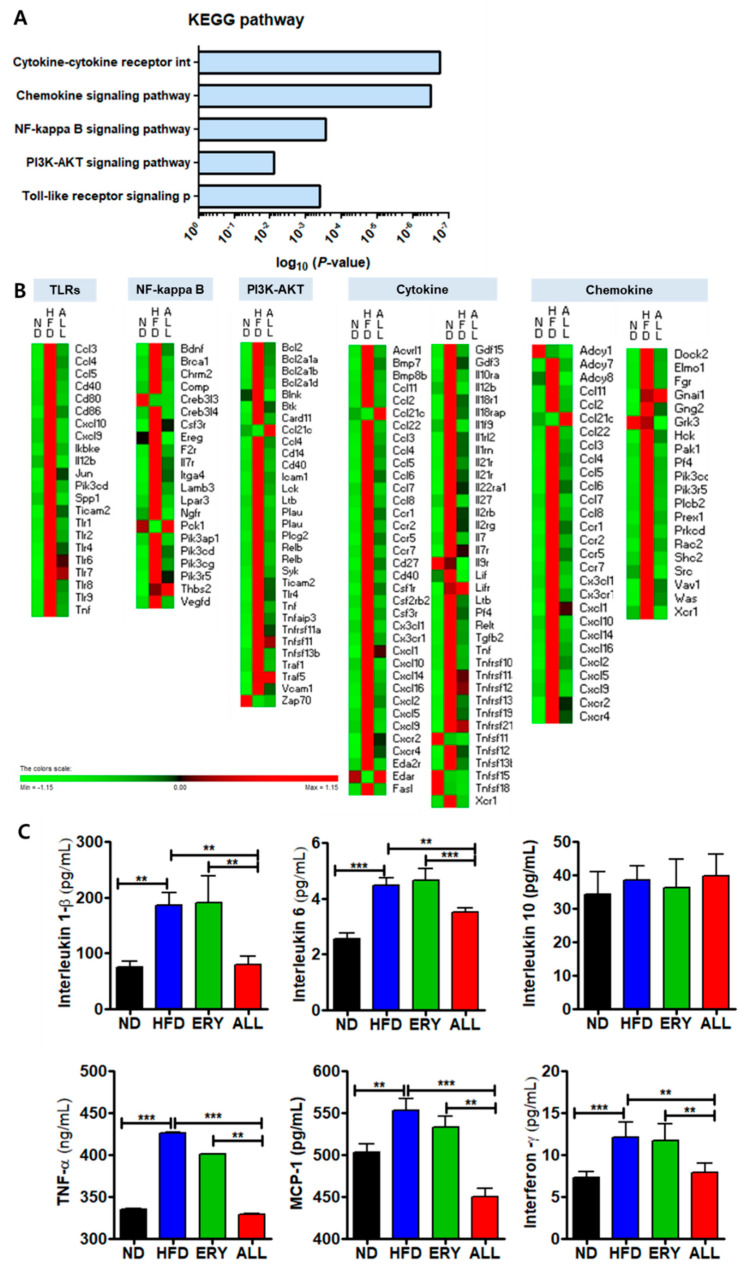
Figure 4.
Gene transcription patterns related to inflammation in hepatic tissue. (A) Significant KEGG pathways. (B) The heatmap shows genes associated with the Toll-like receptor, NF-kappaB, PI3K-AKT, cytokine, and chemokine pathways. (C) Plasma inflammatory cytokine levels. Symbols in red were upregulated, whereas those in green were downregulated. Significant differences among the experiment groups are indicated; * p < 0.05, ** p < 0.01, *** p < 0.001; ND, normal diet (AIN-76); HFD, high-fat diet (AIN-76, 20% fat, 1% cholesterol); ERY (HFD + 5% Erythritol); and ALL, (HFD + 5% D-allulose).

