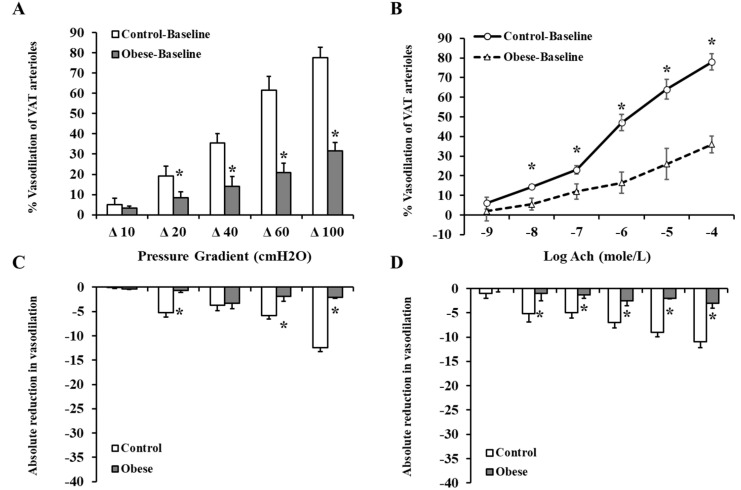
Figure 4.
FID and AChID in VAT isolated resistance arterioles. FID measurements in VAT arterioles isolated from obese (n = 40) and non-obese (n = 40) subjects corresponding to increasing intraluminal pressure gradients of 10–100 cmH2O (A). AchID measurements in VAT arterioles corresponding to increasing concentrations of Ach (10−9 to 10−4 M) (B). Absolute reduction in FID in response to eNOS inhibition via L-NAME (10−4 M) (C). Absolute reduction in AchID in response to eNOS inhibition via L-NAME (D). All measurements are presented as means ± standard error (SE). * (p < 0.05) for comparing obese subjects with controls.

