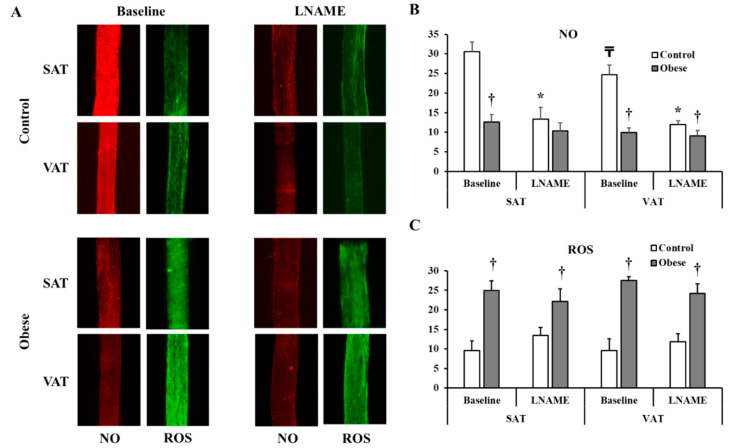
Figure 8.
NO and Reactive Oxygen Species (ROS) production in isolated adipose tissue arterioles. (A): Representative images by fluorescence microscopy of NO (red fluorescence) and ROS (green fluorescence) generation at baseline conditions and after incubation with L-NAME in adipose tissue arterioles collected obese subjects (n = 40) and non-obese controls (n = 40). The charts present NO (B) and ROS (C) fluorescent signals that were measured and expressed in arbitrary units using NIH Image J software. All measures are represented as means± SE. * (p < 0.05) for comparing L-NAME to baseline in each group, † (p < 0.05) for comparing obese subjects with controls, and ₸ (p < 0.05) for comparing SAT and VAT arterioles in each treatment condition.

