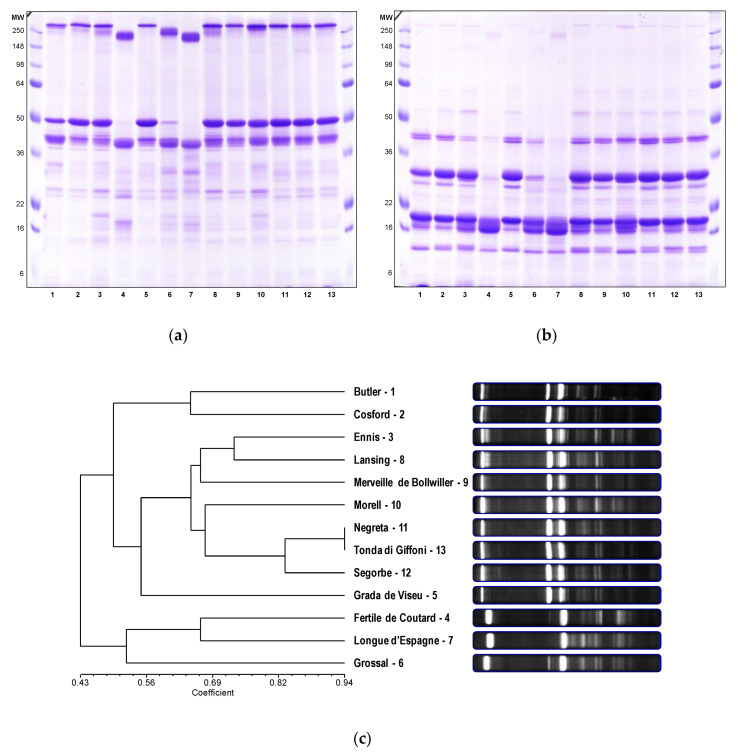
Figure 2.
(a) Native and (b) reduced hazelnut protein electrophoretic profiles analyzed by SDS-PAGE using a 12% gel. Legend: lane 1, ‘Butler’; lane 2, ‘Cosford’; lane 3, ‘Ennis’; lane 4, ‘Fertile de Coutard’; lane 5, ‘Grada de Viseu’; lane 6, ‘Grossal’; lane 7, ‘Longue d’Espagne’; lane 8, ‘Lansing’; lane 9, ‘Merveille de Bollwiller’; lane 10, ‘Morell’; lane 11, ‘Negreta’; lane 12, ‘Segorbe’; lane 13, ‘Tonda di Giffoni’. Sizes (in kDa) of the protein molecular weight marker (SeeBlue™ Plus2 Pre-stained Protein Standard, Thermo Fisher Scientific, Massachusetts, USA) are shown on the left and right of the gel. (c) Dendrogram of genetic similarity among the 13 hazelnut varieties based on protein markers. The unweighted pair group method with arithmetic mean was calculated with the Jaccard’s similarity coefficient. The cophenetic correlation coefficient (r) for this matrix was 0.846.

