Figure 1.
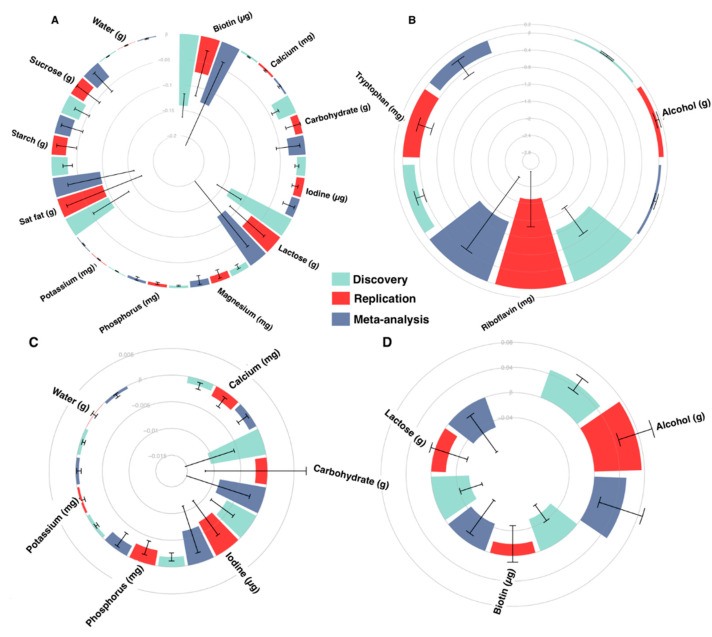
Meta-analysed nutrient associations with blood pressure. Nutrient-BP associations from the discovery population (False Discovery Rate (FDR) < 0.05), replication population (P < 0.05 or same direction beta) and meta-analysis. Because of the scale and comparative differences of effects, panels display varying effect sizes to facilitate visualisation of effects. SBP associations are illustrated in panels (A) (Beta: −0.2 to 0) and (B) (Beta: −2.8 to 0.2), and DBP associations are illustrated in panel (C) (Beta: −0.015 to 0.005) and (D) (Beta: −0.04 to 0.08). Error bars display SE. Results from the discovery cohort are represented in teal, from the replication cohort in red and from meta-analyses in blue.

