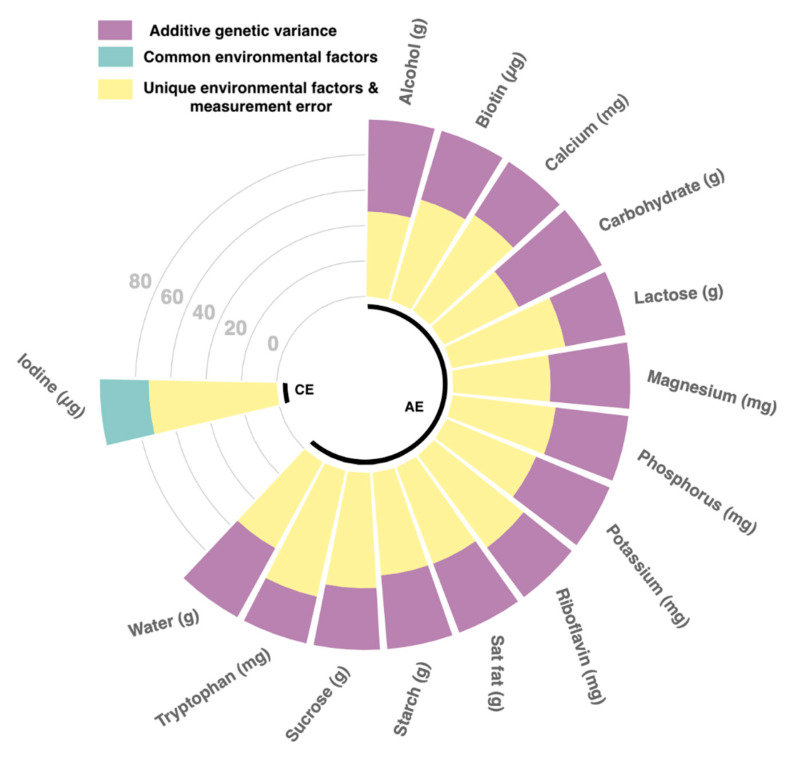
Figure 2.
Circus plot of heritability for significantly associated nutrients. Plot of heritability analysis depicting sources of phenotypic variation for the 15 nutrients significantly associated with blood pressure. Nutrients in group AE were genetically derived, whereas nutrients in group CE were environmentally determined (model lowest AIC). Purple bars represent additive genetic variance, teal represent common environmental factors and yellow specific environmental factors & error.

