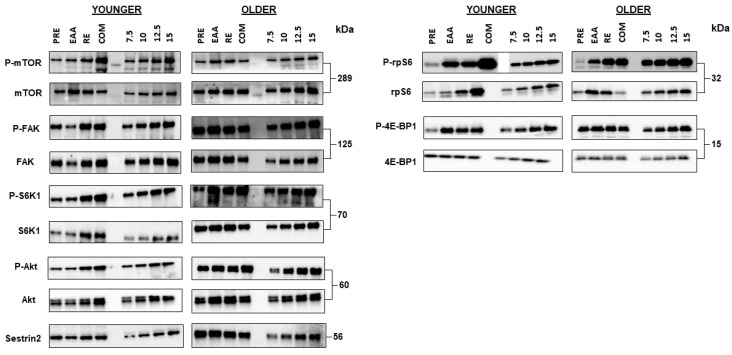
Figure 3.
Representative blots for each total and phosphoprotein. Blots are in the following order: baseline, EAA, RE, and COM. The fifth lane is occupied by the protein ladder. To the right of the experimental blots, the loading controls (calibration curves) are shown (i.e., 7.5, 10, 12.5, and 15 µL of protein).

