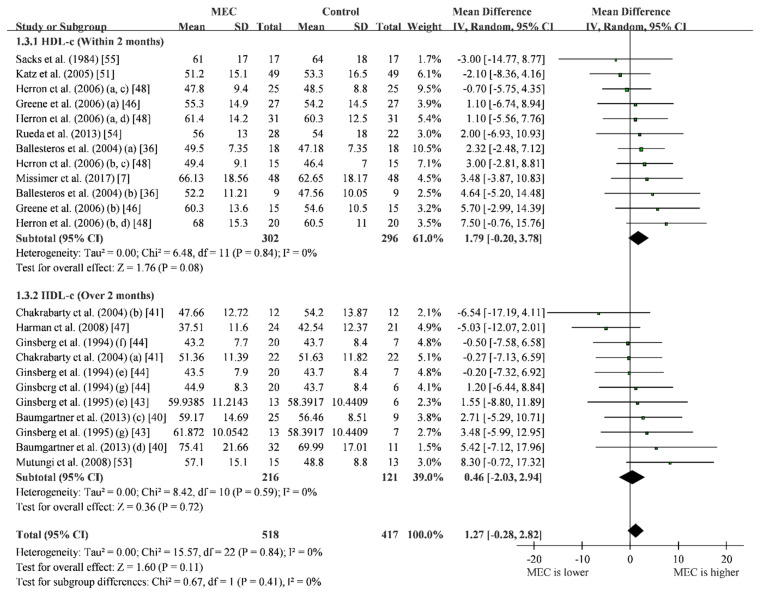
Figure 4.
Forest plot of high-density lipoprotein cholesterol (mg/dL) for studies that the lipid levels were reported separately, we presented in different rows in forest plots. (a) hypo-responder group; (b) hyper-responder group; (c) men group; (d) women group; (e) one-egg group; (f) two-eggs group; (g) ≥ three-eggs group. Black diamond refers to no statistical significance in pooled analysis.

