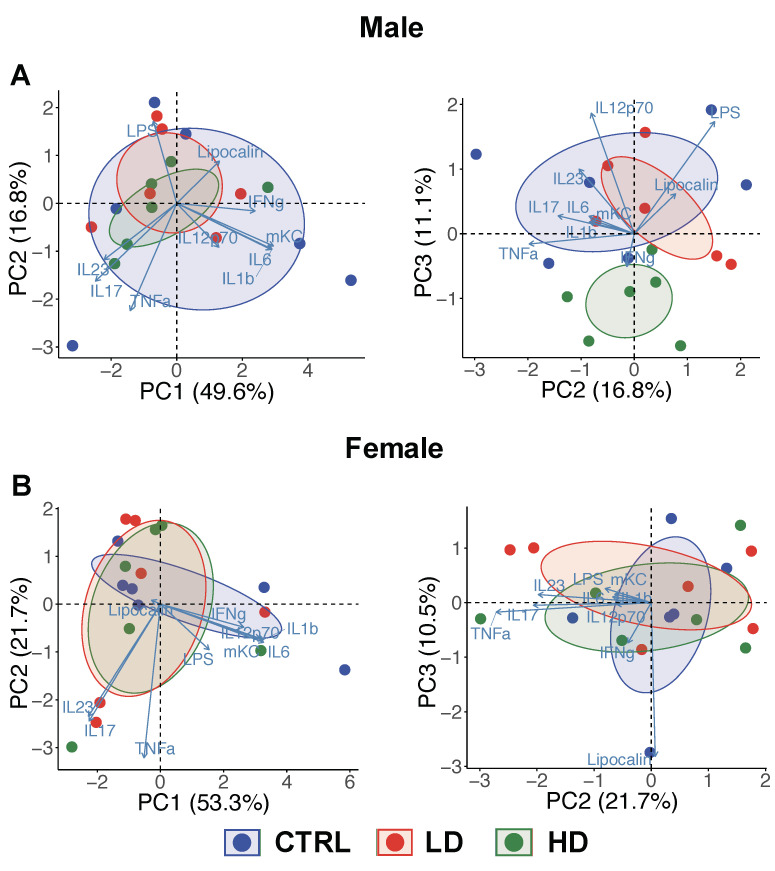
Figure 3.
The isomaltodextrin (IMD) intervention association with the variability of inflammatory responses in male IL-10−/− mice at Week 12. Principal component analysis (PCA) plot shows a 2-dimensional scatter plot (PC1 vs. PC2; PC2 vs. PC3) comparing the variation of inflammation between control (CTRL), low-dose IMD (LD) and high-dose IMD (HD) in (A) male and (B) female mice, respectively.

