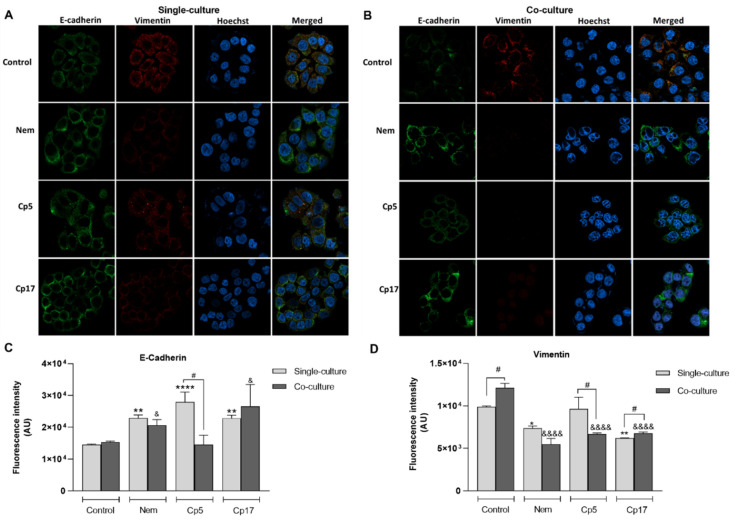
Figure 7.
Effect of Nem, Cp5 or Cp17 (concentrations used, 12 µM, 25 µg/mL, 13 µg/mL, respectively) (half IC50/24 h, Table 3) on the expression of EMT-related markers E-cadherin and vimentin in HT-29 cells. (A) Single culture; (B) co-culture with M2-like macrophages. Images magnification: 40×, E-cadherin is stained in green and vimentin in red. (C–D) Nuclei are stained blue with Hoechst. Data reported as the mean ± SD of three independent experiments. * p< 0.05, ** p < 0.01, **** p < 0.0001 vs. control (single culture). & p< 0.05, &&&& p < 0.0001 vs. control (co-culture), # p < 0.05 difference between single and co-culture.

