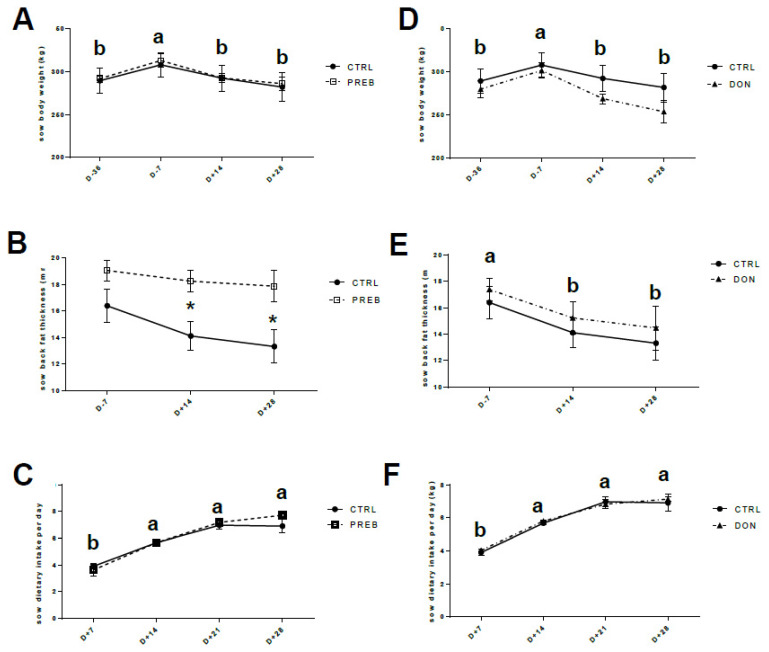
Figure 2.
Sow performance. On left, comparison of control (n = 4, CTRL, full circle) and PREB (n = 4, PREB, empty square) groups and on right, comparison of CTRL and contaminated sows with DON (n = 4, DON, full triangle). Normally distributed data were analyzed using a two-way ANOVA performing time, diet and the interaction between these two factors, followed by Tukey’s multiple comparison tests when appropriate Time effect: a, b means with different letters are significantly different (p < 0.05). (A,D) Sow body weight (kg) was recorded at 36 and 7 days before, and 14 and 28 days after parturition. (B,E) Back fat thickness (mm) was measured ultrasonically at 7 days before, and 14 and 28 days after parturition (significant difference at (* p < 0.05) for CTRL and PREB). (C,F) Sow feed intake (kg) was recorded weekly from D+ 7 to D+ 28 after parturition.

