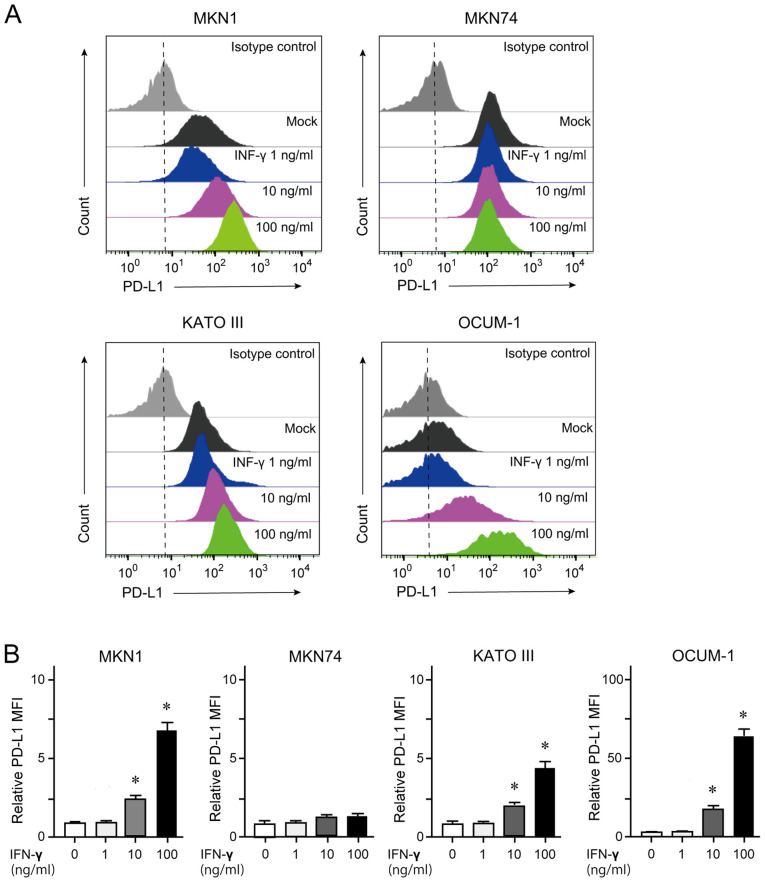
Figure 2.
Flow cytometry analysis of membrane-bound PD-L1in GC cells. (A) Histogram analyses of PD-L1 expression in GC cells treated with various concentrations of IFN-γ for 24 h. (B) Mean fluorescent intensity according to data from (A) *P<0.05. PD-L1, programmed death-ligand 1; IFN-γ, interferon γ; GC, gastric cancer.

