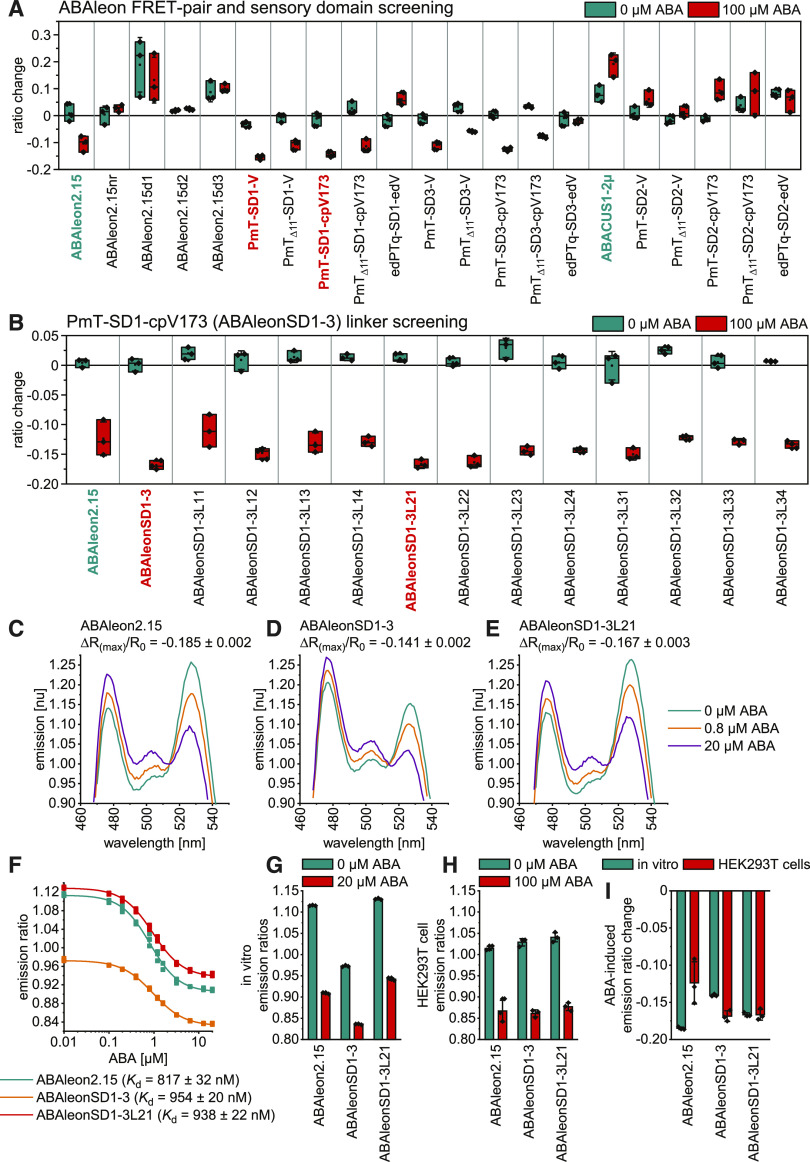
Figure 1.
Development of ABAleonSD1-3L21.
(A) and (B) FRET-pair and SD (A) and linker screening (B) of ABA indicator variants after expression in HEK293T cells. Shown are emission ratio changes in response to 60-min treatments with 0 and 100 µM ABA. Central lines in boxes, median; boxes, 25th and 75th percentiles; diamonds, data points; square dots, mean; whiskers, ±sd. Reference indicators are shown in cyan and new candidates in red.
(C) to (E) Representative ABA-dependent normalized (nu) in vitro emission spectra of ABAleon2.15 (C), ABAleonSD1-3 (D), and ABAleonSD1-3L21 (E) with indicated ΔR(max)/R0.
(F) ABA-dependent in vitro emission ratios and apparent ABA Kd of ABAleons.
(G) and (H) Comparison of ABA-dependent ABAleon emission ratios (mean ± sd, n = 3; diamonds, data points): in vitro (G) and in HEK293T cells (H).
(I) In vitro and HEK293T cell comparison of ABA-induced maximum emission ratio changes (mean ± sd, n = 3; diamonds, data points).
Information on ABA indicator topologies is given in Supplemental Figure 1.

