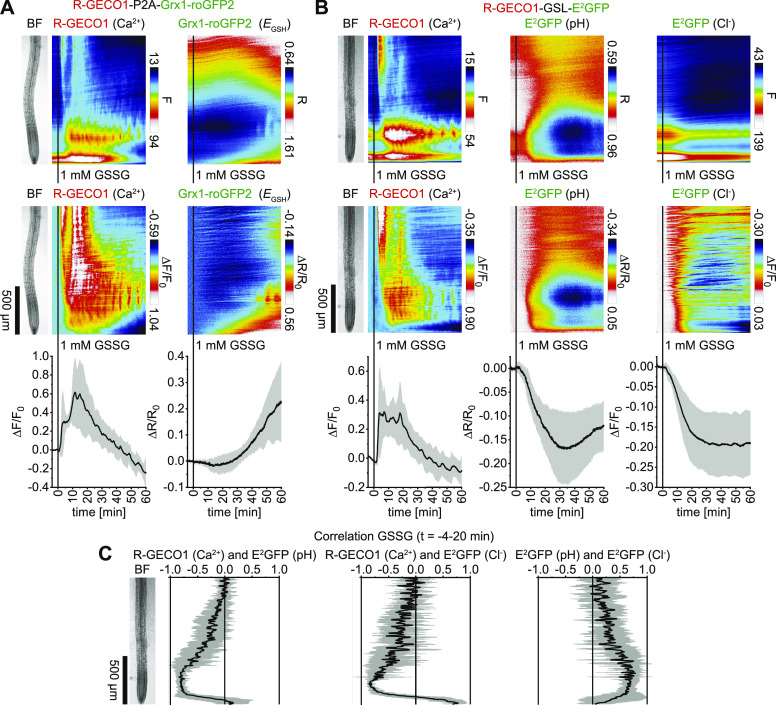
Figure 10.
GSSG-Triggered Cytosolic Concentration Changes of Ca2+, H+, and Cl– Precede a Cytosolic Oxidation.
(A) and (B) Analyses of roots of 5-d-old Arabidopsis expressing R-GECO1-P2A-Grx1-roGFP2 (Ca2+ and EGSH; n = 5; see [A]) and R-GECO1-GSL-E2GFP (Ca2+, pH and Cl–; n = 6; see [B]) in response to 1 mM GSSG (t = 0 min). Images were acquired for 64 min at a frame rate of 10 min−1. Average vertical response profiles of (top) fluorescence emissions (F) or emission ratios (R) and (middle) signal changes (ΔF/F0 or ΔR/R0) normalized to 4-min average baseline recordings. (Bottom) Full image signal changes (mean ± sd).
(C) Spatiotemporal Pearson correlation analyses (mean ± sd) of indicated GEFI responses during the application of GSSG (t = –4 to 20 min; data from [B]). An adjacent representative bright field (BF) root image is shown for orientation.
Representative experiments are provided as Supplemental Movies 15 and 16.

