Figure 11.
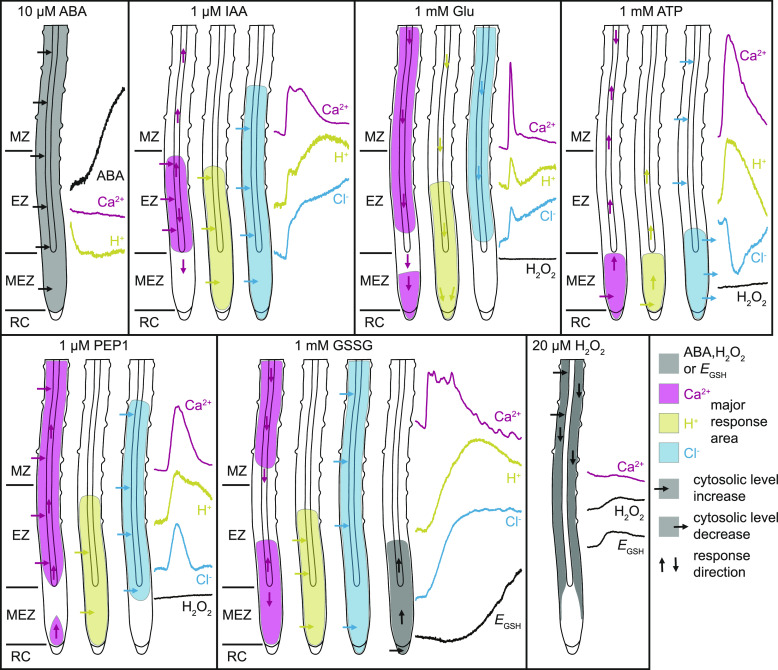
Schematic Model of Observed Cytosolic ABA, Ca2+, H+, Cl–, and Redox Changes in Arabidopsis Roots.
ABA treatment and uptake did not induce rapid cytosolic Ca2+ or H+ concentration changes. By contrast, IAA, glutamate (Glu), ATP, PEP1, and GSSG triggered cytosolic Ca2+, H+, and Cl– concentration changes with high spatiotemporal overlap. For comparison of the obtained data see also Supplemental Figure 8 and Supplemental Movies 4, 5, 14, and 16. Compared to 20 µM H2O2 and 1 mM GSSG, redox changes in response to Glu, ATP, and PEP1 were very low and below the threshold required to trigger ROS-induced Ca2+ signaling. Regions with highest response are color coded according to the adjacent response curves that were taken from the corresponding main figures (ABA, H2O2, and EGSH, black; Ca2+, magenta; H+, yellow; Cl–, cyan). For a better illustration of cytosolic H+ and Cl– concentration increases, the PA-17 and E2GFP response curves were inverted. Horizontal arrows indicate cytosolic concentration increase or decrease and vertical arrows the direction of the response. EZ, elongation zone; MEZ, meristematic zone; MZ, maturation zone; RC, root cap.

