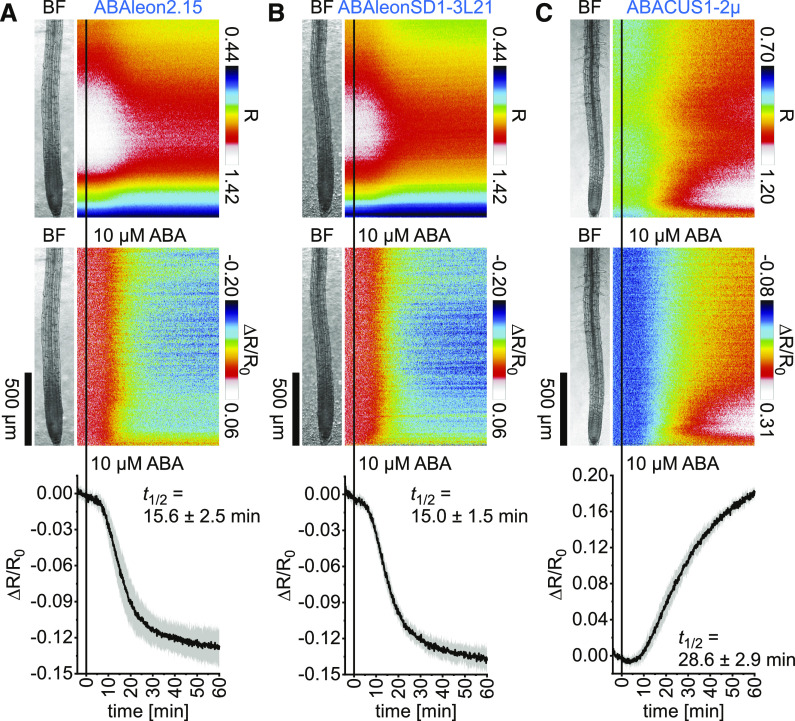
Figure 2.
Comparison of ABA Indicator ABA Responses in Arabidopsis.
(A) to (C) Roots of 5-d-old Arabidopsis expressing ABAleon2.15 (n = 9; see [A]), ABAleonSD1-3L21 (n = 8; see [B]), and ABACUS1-2µ (n = 6; see [C]) were imaged for 64 min at a frame rate of 10 min−1 and treated with 10 µM ABA at t = 0 min. Shown are average vertical response profiles of emission ratios (R; top) and emission ratio changes (ΔR/R0; middle) normalized to 4-min average baseline recordings. An adjacent representative bright field (BF) root image is shown for orientation. (Bottom) Full image average emission ratio changes (mean ± sd) with indicated t1/2.
A representative experiment is provided as Supplemental Movie 1. Data of 0 µM ABA control experiments are shown in Supplemental Figure 2.

