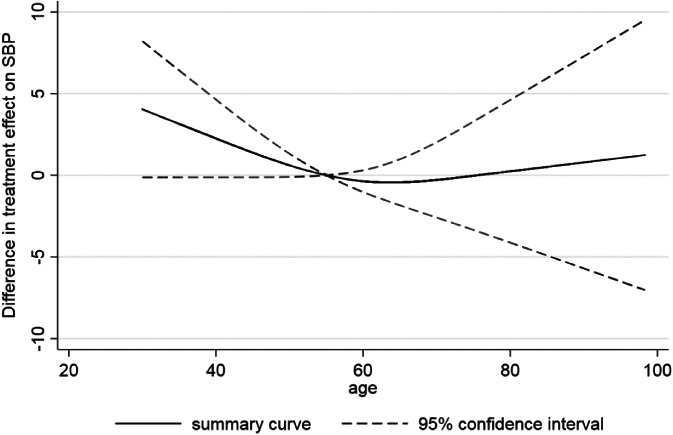
Figure 3.

Summary of the nonlinear interaction between age and effect of hypertension treatment on final SBP value. Figure created by fitting an analysis of covariance model in each study separately, with the interaction between age and treatment modeled via a restricted cubic spline function (with knot positions of 39, 60, and 75), and then the study‐specific parameter estimates (relating to the interaction) pooled in a multivariate random‐effects meta‐analysis
